“Life is ten percent what happens to you and ninety percent how you respond to it.”
- Lou Holtz
“Reality trades at lower multiples.”
- Peter Atwater
There is an old joke about economists that seems remarkably apropos these days given the market, financial, and economic data the most recent quarter provided. The crux of the joke is that we should (please forgive the visual) remove every economist’s left hand so that they cannot say, “but, on the other hand,” when trying to explain data, behaviors, or how economies are supposed to work. Mediocre as the joke might be, it is timely. After all, for every positive data point observed during the third quarter, it seemed that a contradictory one was never too far behind. Maybe my handy Waze app failed me, not noticing the “signpost up ahead,” and mistakenly directed me into 2023’s version of the Twilight Zone. Or maybe there are just too many economists around with fully functional left hands.
Is the U.S. consumer tapped out or not? According to several articles I read (including some nifty data and charts included in those news sources), U.S. consumers have just about exhausted all their built-up, pandemic-related savings. Well, September’s retail sales increased 0.7%, more than double expectations and Americans continue to spend. Housing prices? Those must have tanked of late in the face of substantially higher interest and mortgage rates. Nope. Housing prices nationally were up during the quarter. Same with stock prices, right? Negative. Markets have dipped of late, but the S&P 500 and NASDAQ remain solidly green this year, despite modest declines in September. Banks must be falling like dominoes as their cost of funds skyrocket, lending activity dries up, and loans, especially on office properties, sour like the Dodger’s pitching staff. Nope, not yet. So, let’s dig into some of the data…
Treasury yields have ballooned since July, rising from 3.86% at the start of the quarter to 4.59% at quarter-end (and a whisper away from 5.0% at last glance), a tremendous rise, nearly 20% in relative terms, while inflation mostly steadied. Residential single-family mortgage rates followed a similar path, with 30-year rates rising from 6.7% to over 7.5% (and over 7.90% today).
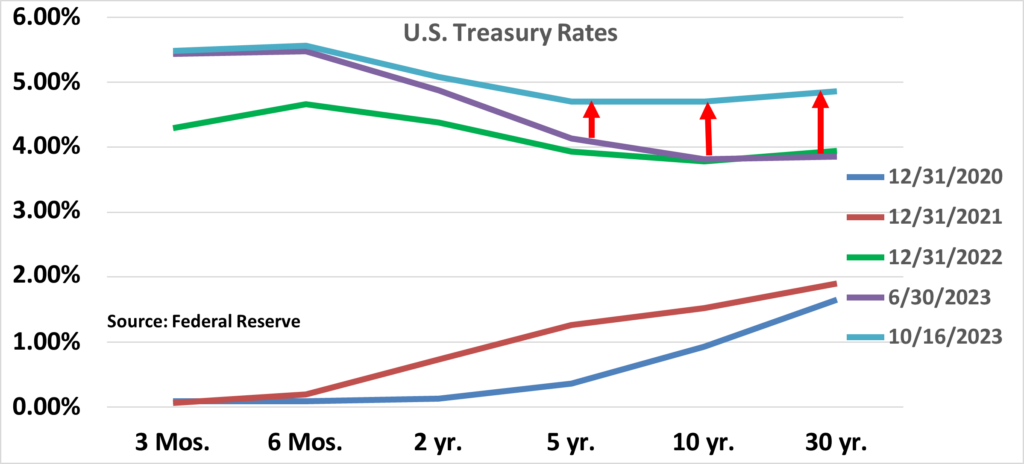
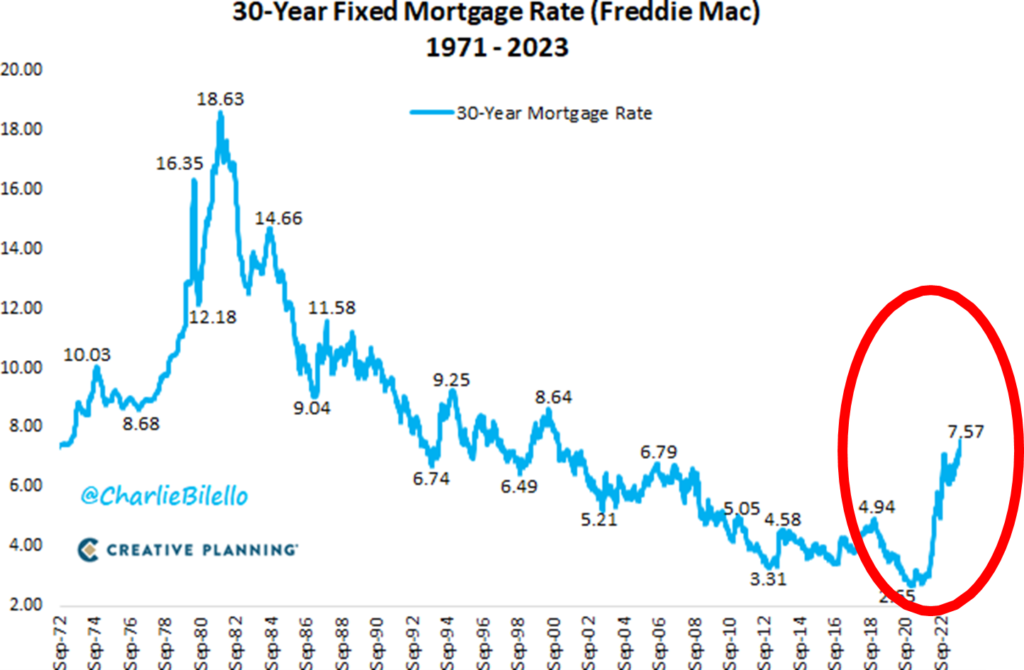
However, stock indices mostly yawned in response, with the S&P 500 and NASDAQ both down only about two percent during the quarter, a far more modest decline than one might have expected in the face of these higher rates, the specter of additional rate hikes this year and next, Fitch’s downgrade of the U.S.’s credit rating in August, another looming government shutdown, and expectations that corporate earnings are expected to decline a collective 5.2% during the third quarter, all perhaps foretelling an economic slowdown, if not a recession.
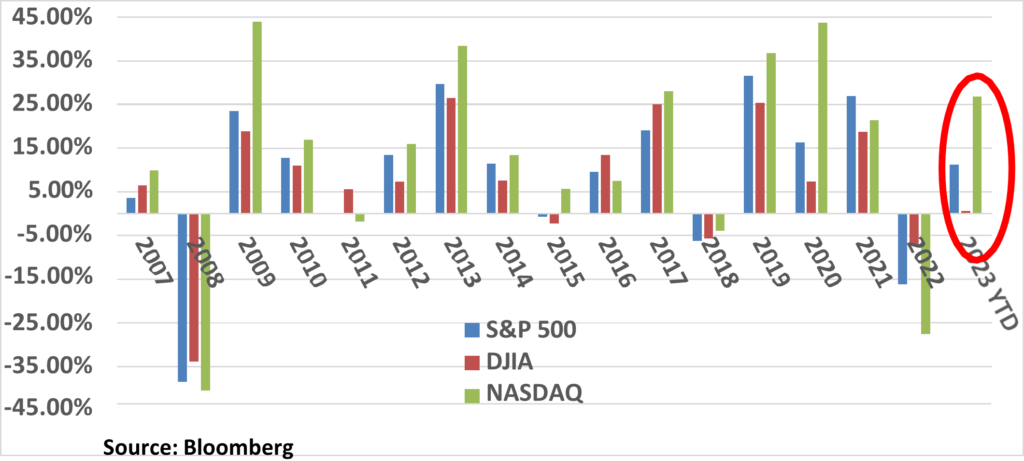
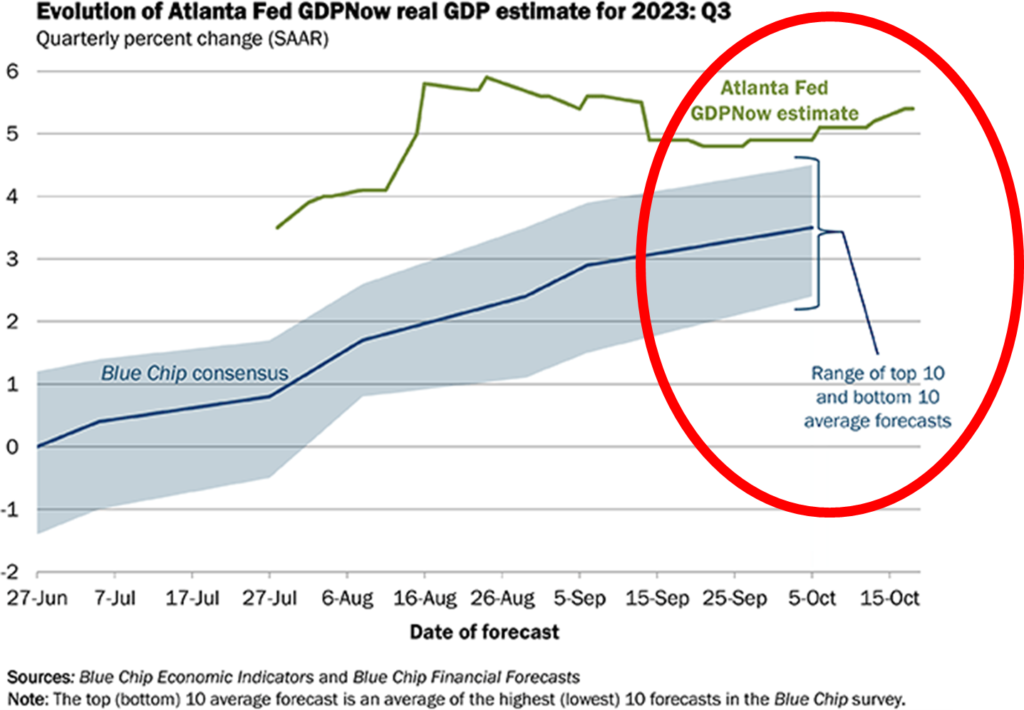
Meanwhile, oil prices increased like there is no recession in sight, up about 30% during the quarter, while gold prices, the traditional inflation and uncertainty hedge, declined. Oh, and real growth in GDP? After increasing 2.4% in the second quarter, the International Monetary Fund just raised its U.S. growth projection for this year by 0.3%, to 2.1% earlier this month, as compared to its forecast in July. That’s right. They raised guidance, and here’s what’s head- turning. This revised growth estimate is larger than what they had projected for U.S. growth back in 2019, before the pandemic. Meanwhile, the Federal Reserve Bank of Atlanta predicts
that real third quarter GDP growth was…5.4%, a real outlier, and more than double second quarter GDP. Really? Well, here you go…
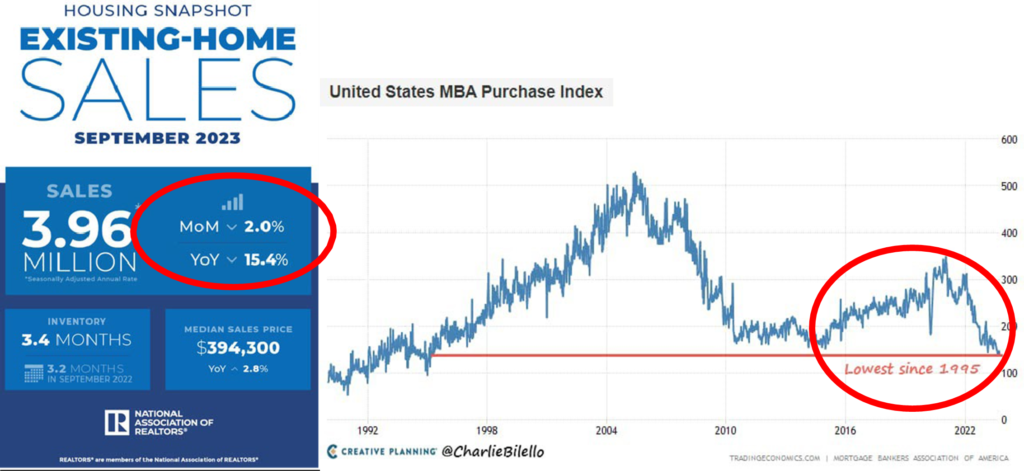
And home prices? They must have dropped precipitously with mortgage rates reaching levels not seen in over 20 years. Nope. Home prices rose a seasonally adjusted 2.0 percent during the quarter. That isn’t to say that every residential housing market witnessed higher home prices, but we can’t be all that surprised that home prices in Phoenix, Austin, Boise, or Seattle have fallen modestly this year, given how sharply prices in those markets rose over the past several years. But there ain’t all that much red on this particular map.

Single-family transaction volumes are another story, however, as they have fallen off a cliff, so to speak, as both buyers and sellers mostly sit on the sidelines in a state of housing “couch lock.” Mortgage applications hit a 28-year low during the quarter and firms like Rocket Mortgage and their peers appear grounded.
Indeed, from nearly every vantage point, I see economic warning signs flashing and am concerned that we are in for a harder landing than many anticipate, but the markets don’t seem to agree with me, as they remain fairly resilient, if not complacent. And this was before recent unrest in the Middle East and the ongoing political circus in our nation’s capital. While Barnum & Bailey’s may have closed shop a number of years ago, they have apparently set up tent in Washington, an appropriate venue for the House to elect a new Speaker. I fully expect Bozo to appear on a Speaker ballot soon enough.
So, let’s take a more detailed peek at these and other seemingly contradictory data points to try and get a better sense of where the economy and markets have been and where they might be headed.
Contradiction One: “The Consumer is Tapped Out”
According to recent data, U.S. households have now expended virtually all of the savings they accumulated during the pandemic. According to the San Francisco Fed, U.S. household savings declined from $2.1 trillion (trillion with a “t”) in 2021 to about $190 billion at the end of June or roughly $100 billion each month, which would imply that household savings are now entirely depleted. That is, the consumer is tapped out and ready to capitulate. Here are a few of those nifty graphs I referred to earlier:


However, as mentioned above, September retail sales were up 0.7% year-over-year, more than double expectations, as Americans continue to spend. And spend. And spend. On restaurants. On travel, leisure, and gaming. On Ozempic. On experiences like U2 at the Sphere or Taylor Swift anywhere. What was Cyndi Lauper’s hit song from way back when? Wasn’t it, “Americans just wanna have fun?” Yes, they certainly do.

How can that be? Where is the consumer finding its mojo? Consumer debt? Home equity lines of credit? Higher wages? Second jobs? Cash and coins hidden behind sofa cushions? In a word, “yes,” though I am not sure how much spare change can be found in or under your typical Lazy Boy.
Higher household debt offers one clue. Specifically, credit card balances increased $45 billion during the second quarter (latest available data), to $1.03 trillion, a record, having increased significantly since the end of the pandemic. Auto loan balances have also increased significantly.


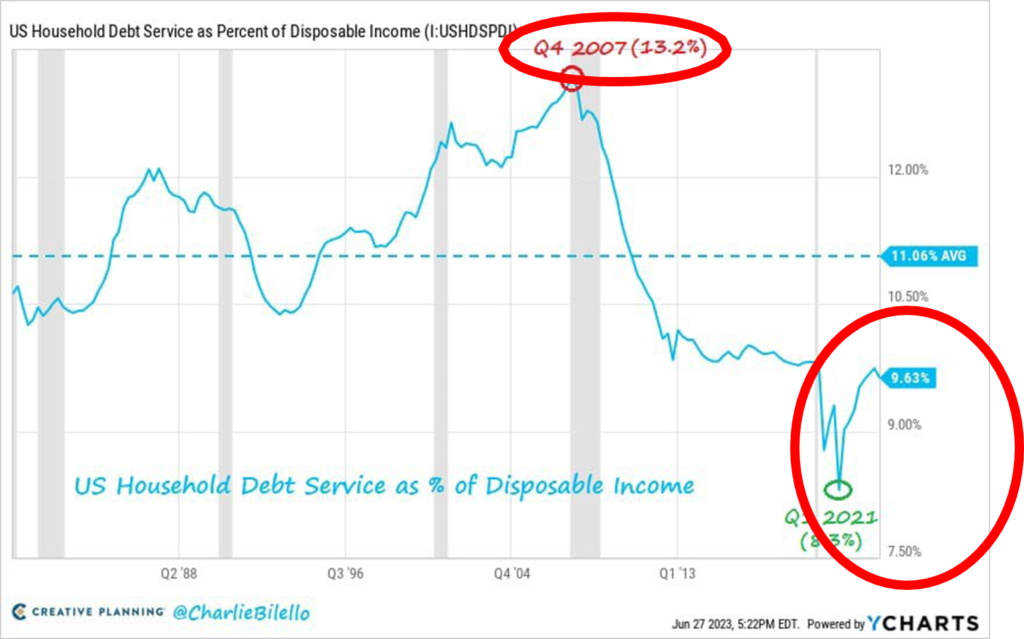
The average interest rate on a new car loan just hit a record 7.2%, while the average interest rate on a used car loan is now 11.0%. The average new car payment in the U.S. is now $750 and the average new mortgage payment is $2,850. This means that an average American who wants a new car and home is paying $3,600 each month ($43,200 a year), or over 60% of median household income. Necessities have apparently become luxuries. However, even with these increased debt levels, the relationship between household debt and disposable income looks far different today than it did immediately preceding the Great Financial Crisis and well below long- term averages, although it has increased since this relationship hit an all-time low in Q1 of 2021.
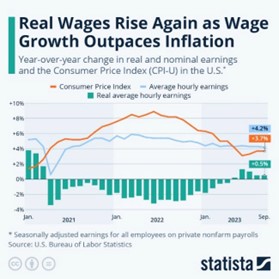
Higher wages likely offer another explanation. Average hourly wages were up 4.2% in September (year-over-year) exceeding inflation (3.7%), continuing recent trends and reversing decades of stagnation. Recent strikes of the Writers Guild, Kaiser Permanente, and UPS have resulted in materially higher wages for union members, as they flex their collective muscles in a surprisingly tight employment market. According to one data source, some 457,000 workers have participated in 315 strikes so far in 2023 involving over 360,000 workers, including the
ongoing United Auto Workers strike. Maybe UCLA faculty members are next, so stay tuned. Live better, work union, I say!

Separately, I read that commuters save $51 for every day that they are able to work remotely, so perhaps the post-pandemic hybrid work model is also providing some marginal spending oomph. Maybe those sub-3.0%, 30-year residential mortgage rates (and sub-2.0% rates for 15- year mortgages) from 2021 and the lower mortgage payments that result, are also providing some marginal spending cash for those lucky mortgage lottery winners. Maybe it’s all those Uber and Lyft drivers working multiple jobs (see below).
In any case, whether the consumer can continue to power the economy forward in the face of depleted savings, higher borrowing costs on everything from credit cards to auto loans, the restarting of student loan payments after a two-year hiatus, and so much uncertainty here and everywhere, remains to be seen. So far, the answer seems to be “yes.” Regarding those student loan repayments, they are set to resume in October for the first time since 2020. In fact, a total of 45 million people in the U.S. have student loans, with about $1.6 trillion of student loans outstanding. Assuming an average monthly student loan payment of $200, roughly $9 billion in potential consumer spending will be curtailed. While not insignificant, I don’t think that these additional obligations will sink the consumer overall.

Or maybe I am just wrong, and the secret does indeed lie behind the sofa cushions.
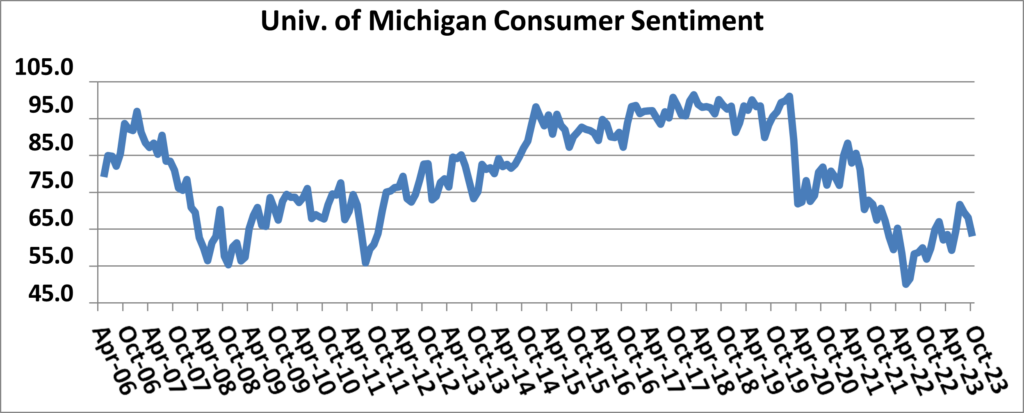
Finally, here is one other trend not getting much attention. Consumer sentiment, while still low from a historical perspective, was surging upward at one of the fastest clips in modern history through July, but has declined every month since, according to the University of Michigan.
While well above last June’s all-time low, consumer sentiment is well off from pre-pandemic levels. But maybe it is just one of those anomalies that even if consumers aren’t feeling so hot, they will escape to restaurants, a Rams Game, or the Sphere to try and cheer up.
Contradiction Two: “The job market in in surprisingly excellent shape”
In September, the economy added 386,000 jobs, more than double estimates, while the unemployment rate remained steady at 3.8%, more than “full employment.” The high-level figures are solid.
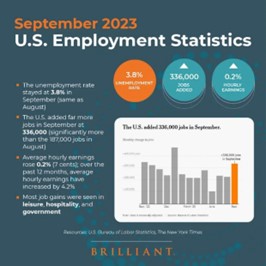

And every state is benefitting, even California, where the unemployment rate is a reasonably healthy 4.5%, despite rumors and media reports that everyone is “fleeing” the state.

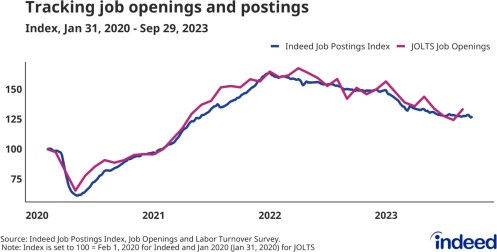
And job openings? As of the end of August (most recent available government data), there were
9.6 million job openings, an increase of 690,000 over the prior month, and according to the Bureau of Labor Statistics, these openings cross numerous sectors: professional and business services (+509,000), finance and insurance (+96,000), state and local government education (+76,000), nondurable goods manufacturing (+59,000), and federal government (+31,000).
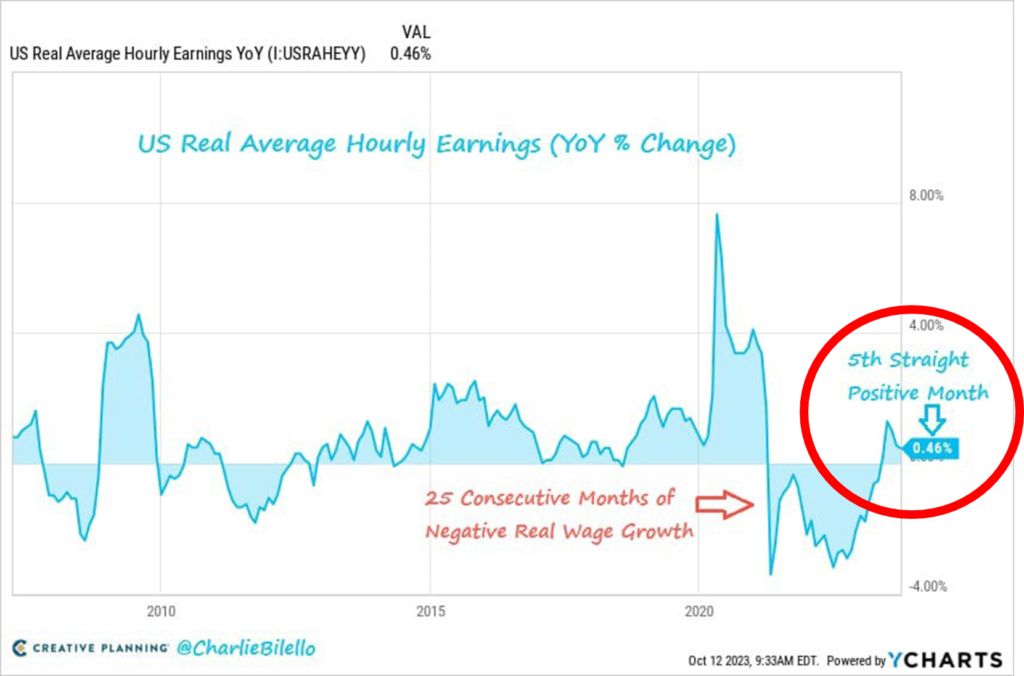
And what about wages? As mentioned above, workers have experienced real wage gains for five straight months, following more than two years of negative real wage growth.
How do I square this rosy employment data with headlines like this, which just appeared on CNBC’s home page last week: “Big Banks are Quietly Cutting Thousands of Employees, and More Layoffs are Coming”? How do firms reduce headcounts “quietly?” They whisper as they escort folks out the door? Well, apparently the five largest U.S. banks have “quietly” cut a combined 20,000 positions this year and more cuts are forthcoming. And anecdotally, I keep hearing about how tough the job market is for many white-collar professionals, from aspiring lawyers to real estate brokers/agents, to mortgage bankers. And some data bears this out, as full-time employment has actually declined since June, down nearly 700,000 jobs.
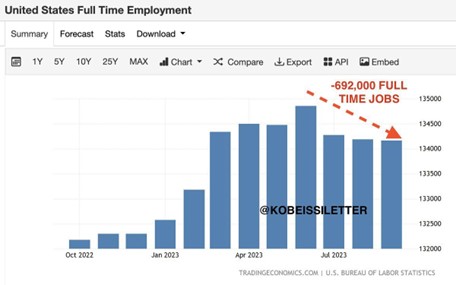
Huh? This sort of data would normally imply we are in a recession. However, what’s peculiar, if not enlightening, is that the number of folks holding two full-time jobs has increased to an all- time high of 447,000. Perhaps that is where the contradiction lies.
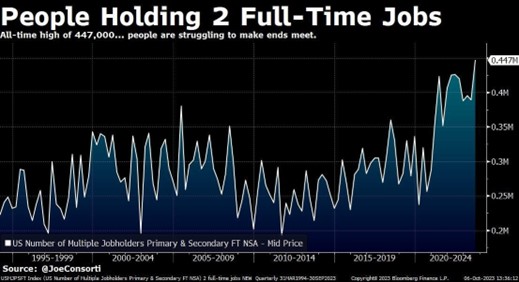
The last few times this occurred during the last 25 years were in 2001, 2008, and 2020. Meanwhile, part-time employment increased by nearly 1.2 million jobs last month. What the heck is going on? Are folks taking on multiple jobs (e.g., driving Uber, delivering for DoorDash, trading crypto) to combat inflation and more easily afford those U2 tickets? Double-dipping while they work from home in their Vuori outfits, unbeknownst to their multiple employers? I’m not sure.
In any event, I suspect that the job market is not quite as strong as headlines and even overall employment figures would have us believe. Perhaps the next quarter or two of job data will provide clearer clues.
Contradiction Three: “Real Estate Prices, Equity Markets, and the Economy Generally Fare Poorly as Interest Rates Rise”
Perhaps one picture tells a thousand words, depicting the performance of the NASDAQ index since 2021 versus 10-year U.S. Treasury yields. What’s peculiar is that the two move in almost perfect correlation until the start of 2023 when they begin to diverge…and widely. How can that be? It can’t all be due to artificial intelligence and investor hype, or…? After all, third quarter earnings are expected to be the “worst in years,” down 5.2%, as a result of higher interest rates and energy prices, at least according to “professional economists,” Wall Street analysts, and market pundits.
Regardless, something has to give, it seems to me. The NASDAQ was down some 5.8% in September and is down about 2.5% this month, so perhaps some cracks are starting to emerge.
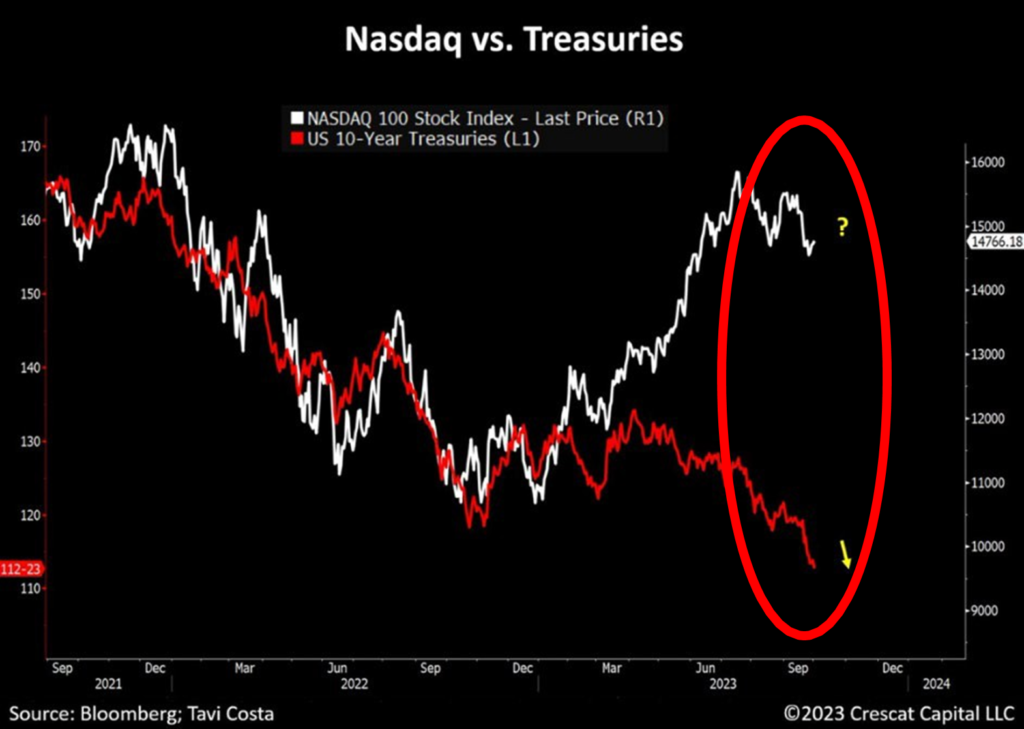
But the markets remain broadly higher this year, despite the higher rates, with the S&P 500 and NASDAQ up 12.5% and 27.2% this year, respectively, at last glance. If you would have told me that the 10-year Treasury yield would be up from 3.88% to over 4.90% during the year, and the equity markets would be up double-digits, I would ask you what alternative universe you had been living in or what cannabis dispensaries you frequent. Yet here we are.
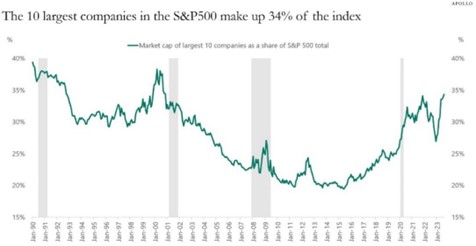
However, much like the jobs data is somewhat misleading, there is more that meets the eye when we peek under the equity market hood. The 10 largest companies in the S&P 500 now comprise over a third of the index, with an average price-earnings ratio of 50. This is the highest percentage of concentration since 2001, during the dot-com era. Even at the 2008 market peak, before the failures of Bear Stearns and Lehman Brothers, the 10 largest companies relative contribution to the S&P 500, peaked at about 26%.
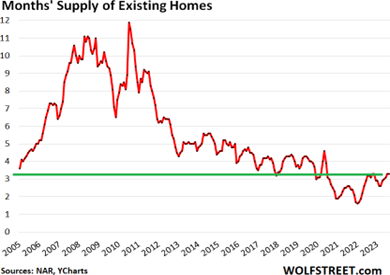
And those home prices? How can we reconcile those higher prices in the face of such higher mortgage rates? It seems inherently contradictory that home sales would fall to their lowest
rates in over a decade, dropping month after month, while prices…rise. The culprit? There simply is not enough supply, barely over three month’s worth, well below historical norms and near historical records.
Anyone who purchased a home in or before 2022 is not likely to sell unless they have to, as they likely have mortgages they are now wedded to, certainly those paying less than 3.0%, proverbial mortgage handcuffs (my least favorite type). And if they were to sell, they would be hit by a double-whammy: substantially higher prices and substantially higher mortgage rates. These homeowners are more likely to move and yet hang onto their homes as rental properties.
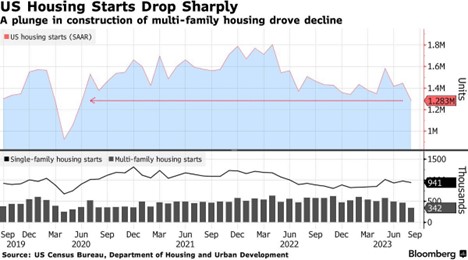
Others, principally the Baby Boomers, have so much equity in their homes that they ain’t selling out of the unattractive prospect of sizable capital gains taxes. Meantime, builders can’t build enough housing (both single- and/or multifamily) for reasons we have explored many times before: lack of buildable lots, labor issues, the cost of capital, restrictive zoning, neighborhood outcry, or a lack of adequate transportation and infrastructure.
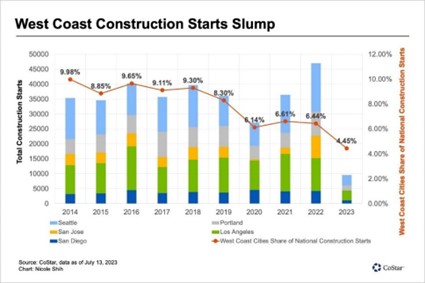
The net result is that the median monthly house payment sits at record levels no matter what state you examine. The math isn’t all that complicated. The monthly payment on a $500K home, with a 30-year mortgage and 20% down, is over $2,800 a month. And that assumes you have
$100K in liquid assets to meet downpayment requirements.
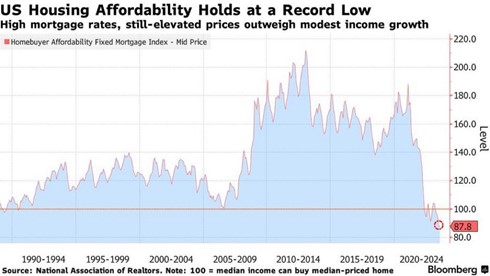
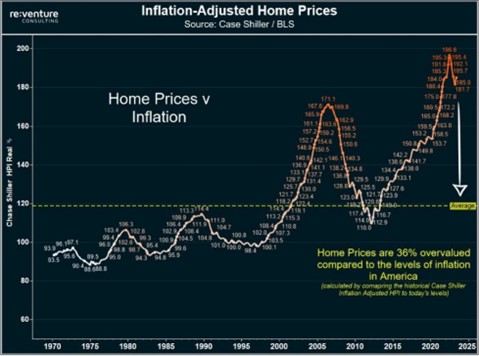
Hawaii became the first state in history with a required median monthly house payment exceeding $5K each month, while California’s median house payment of some $4,800 per month represents 64% of median household income, also a record. In turn housing affordability (shock, shock) just hit another all-time low. Adjusting for inflation, U.S. home prices have increased approximately 118% since 1965, while median household income has increased by just 15%, more than a 7x difference. 90% of major U.S. metros are characterized by price-to-income ratios above the maximum recommended ratio of 2.6. Only six of the 50 most populated U.S. metros have price-to-income ratios of 2.6 or lower: Pittsburgh, Cleveland, Oklahoma City, St.
Louis, Birmingham, and Cincinnati. And as luck would have it, Los Angeles is the least affordable city in the U.S., with the median home costing 9.8 times median income, with San Fransisco a close second, at 9.1x. The bottom line is that Americans need, on average, $114,000 of household income to afford a typical home. That’s tough.
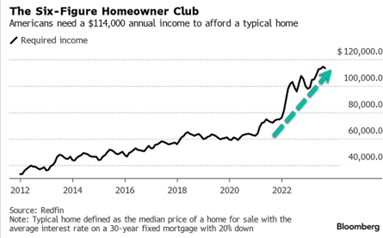
As home prices have risen in the face of dramatically higher mortgage rates and multifamily rents have actually declined modestly (see below) during the same timeframe, housing affordability has reached another auspicious milestone, a record low.
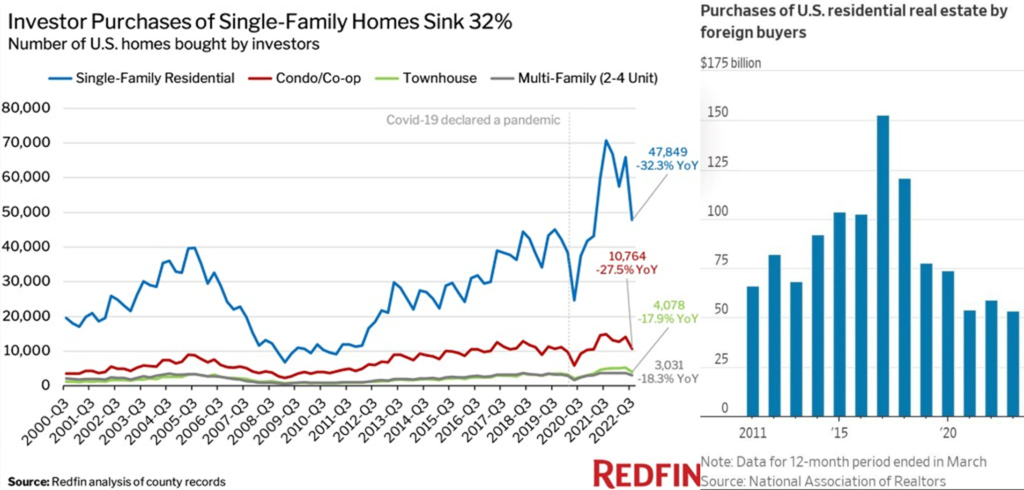
Meanwhile, foreign buying of U.S. homes fell for a sixth straight year, sinking to the lowest level on record. International buyers purchased 84,600 U.S. homes in the year ended in March, down 14% from the prior year, according to the National Association of Realtors (NAR). The dollar volume of homes purchased by these buyers fell 9.6% to $53.3 billion, also a record low since NAR began collecting the data in 2011. Similarly, investors have purchased a third fewer homes this year than last year.
In response to declining transaction volumes and significant affordability headwinds, Zillow announced during the quarter that they will begin offering mortgages with just 1% down, while other lenders are now offering 40-year mortgages. I’m not convinced this is wise or will prove materially impactful. After all, unless sellers want to sell and/or builders are able to build, home sales will remain mired in the muck. In any case, didn’t we learn any lessons from the Great Financial Crisis, that offering more aggressive loans and loan terms to strapped borrowers is not generally a grandmaster-worthy chess move?
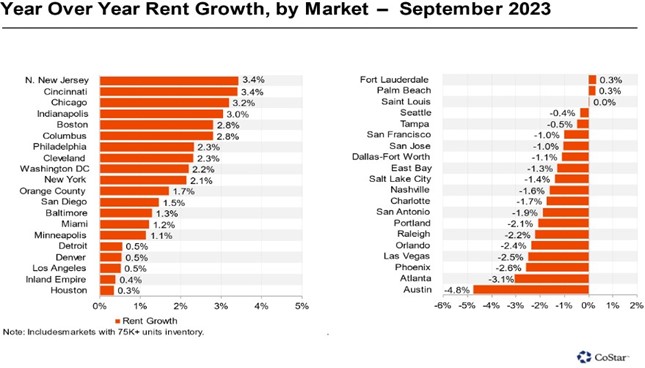
Meantime, shouldn’t multifamily housing benefit from all the single-family residential headwinds? Yes, of course, and it generally is, though rental growth has moderated, and vacancy rates have risen slightly in the face of increased deliveries in markets like Phoenix, Boise, Austin, and Atlanta. Overall rents declined modestly in September, about 1.2% year-over-year.
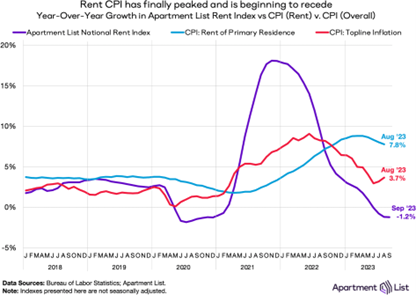
However, some historical perspective is in order. After an unprecedented increase in rents during the pandemic (up some 20%), we shouldn’t be surprised that they have moderated slightly since last year’s peak, and rents should remain in a fairly narrow range until the middle of next year, I suspect, when I believe demand will again catch up to supply, and rents will begin to increase yet again, although at a more normal rate (three to five percent annually).
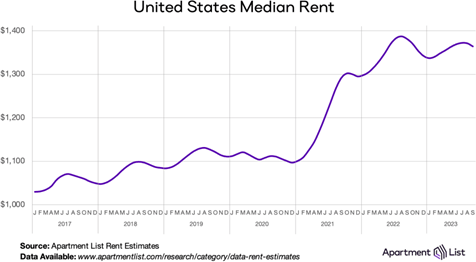
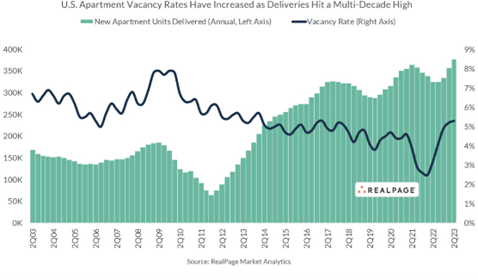
It is the same with vacancies, so while they have risen since the second quarter of last year, they are still just a tad over 5% nationally and have recently begun to level off, as new supply gets absorbed. The key is that multifamily starts have declined precipitously during recent months, which comes as no surprise in the higher-rate, liquidity (both debt and equity) constrained market. Many of the cranes crowding skylines from Phoenix to Denver and Dallas will soon come down and are likely to stay down for a long time. Apartment building starts fell to a seasonally adjusted annual rate of 334,000 units in August, a 41% decline from the pace seen the same month a year prior, according to the Census Bureau. An annual decline of this magnitude has happened only once since the subprime housing crisis.

Obviously, it is a tale of individual markets and just like with single-family home prices, those markets that experienced the largest rental increases over the past several years, from Austin to Phoenix to Atlanta, are returning some of those outsized gains. Meanwhile markets that were generally left behind, those in the Midwest (e.g., Cincinnati, Chicago, Indianapolis), are now experiencing rental growth, albeit at fairly modest rates. In one interesting comparison, someone pointed out that with average San Francisco rent of about $3,500 per month versus rent in Las Vegas of only $1,500 a month, you could possibly commute to work via Southwest Airlines each day between Vegas and the Bay Area and still come out ahead. Of course, just think of what all the salty snacks would do to your blood pressure, let alone going through airline security each day, with or without TSA Pre-check or Clear.
Finally, are apartment cap rates peaking and prices/values therefore, bottoming? There's a growing view among multifamily investors that cap rate expansion is nearing that point, though I wouldn't yet call it a consensus view. After cap rates expanded 60 basis points between the second quarter of last year and the first quarter of 2023, they rose just 10 basis points to 5.2% in the second quarter of this year and the early buzz is they will likely inch up only modestly more in the second half of 2023 as deal flow picks up a bit. But given the relative dearth of transactions, it is hard to say where cap rates actually stand at present.
Finally, I want to revisit one last topic regarding the multifamily market which I discussed briefly in last quarter’s memo and in recent presentations: exploding insurance costs that keep hitting new highs, and in some cases, insurance coverage is not even available as more and more insurers pull out of certain markets (e.g., California, Florida) and reduce coverages or coverage limits, and/or increase compliance requirements everywhere. Natural disasters, inflation and a shrinking reinsurance market have pushed insurance premiums to record levels. That leaves many landlords in a bind and buffered by yet another headwind.
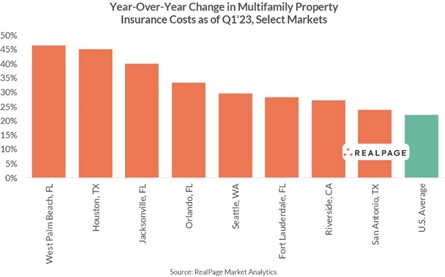
While building values and rental income are generally down across all asset types and geographies, uncontrollable expenses like insurance rates on commercial properties keep rising, having risen 7.6% annually on average since 2017 and by double-digits this year. Those increases can result in hundreds of thousands of dollars or more in additional annual costs, depending on location and size of the property, steep enough to wipe away an entire year of cash flows.
Contradiction Four: “Banks Are Going to Fall Like Dominoes Given Skyrocketing Cost of Funds, Increasing Unrecognized Losses on Investments, Declining Lending Activity Drops, and Mounting Credit Losses”
Following the failures of Signature Bank, Silicon Valley Bank, and First Republic earlier this year, predictions that any number of regional banks (if not one of the money center banks) would follow became commonplace. And yet, based on recent earnings reports from Goldman Sachs, B of A, Chase, Citibank, Wells Fargo, and Morgan Stanley, things do not appear as dire as they might seem. Most banks that have reported third quarter results have beaten forecasts.
Granted, expectations and forecasts have been markedly tempered, but thus far, none of the banks that have reported third quarter results seems in any immediate danger. Perhaps the shoes are yet to drop, but so far, so good. Or maybe not “good,” but “not so bad.”
For example, in its third quarter earnings release, Morgan Stanley indicated that it has set aside
$134 million for credit losses due to “deteriorating conditions in the commercial real estate sector.” B of A reported that its non-performing loan portfolio (those with past due payments of 90 days or more), increased to nearly $5 billion in the third quarter, up from about $4.3 billion at the end of June. Those figures sound ominous. However, everything is relative, and from a broader historical perspective, delinquency rates pale in comparison to what we witnessed leading up to the Great Financial Crisis.

Same with net interest margin, the difference between interest earned on loans and that paid out to depositors. They certainly don’t reveal any material concerns…at least for the time being.
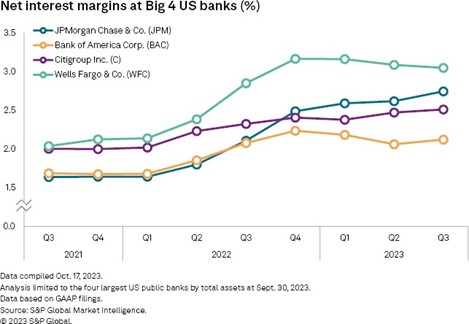
There is no question that the foundational premises for the perspective that additional bank failures are coming are not inaccurate. Banks costs of funds are much higher this year, as depositors move money from traditional savings and checking accounts paying official interest rates formally known as “jack squat”) into higher-yielding money market accounts and certificates of deposits. Lenders have significantly cut loan originations and tightened lending
standards (e.g., raising minimum levels of acceptable credit scores), with loan originations down over 50% this year, across all property types. But let’s face it. It isn’t just banks toughening up standards that is reducing new loan originations but collapsing demand.
Obviously, concerns remain. Over $1.3 trillion of commercial real estate debt comes due between 2023 and 2025, about a trillion of which matures between now and the end of next year. How much of that debt is impaired or potentially troubled? Data is not easy to come by, but some estimates are that about 40% of these loans or more are potentially “troubled.” And that was before the most recent spike in rates, which certainly will not alleviate whatever distress exists.
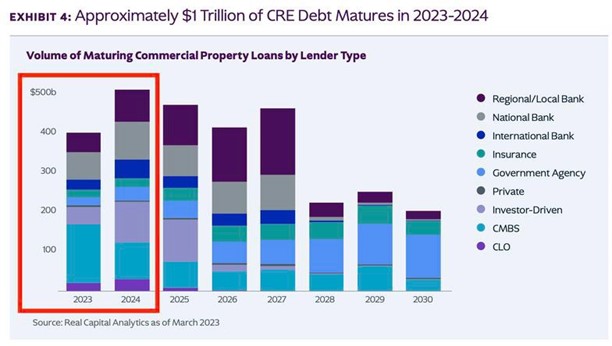
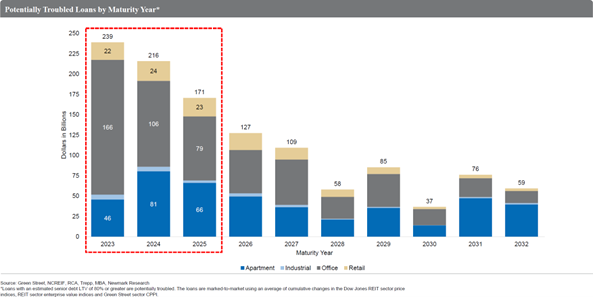
So, if banks curtail lending, where will liquidity and debt capital come from? According to a recent survey, senior loan officers indicate that conditions for loans to businesses and consumers will only get tougher, while loan demand declines in the wake of a less favorable business climate. In fact, the Mortgage Bankers Association predicts commercial-property lending will have fallen 38% by the end of this year, as compared with 2022. Some worry that once-reliable sources of credit will be unwilling to return to their previous levels of lending, leaving property owners high and dry.
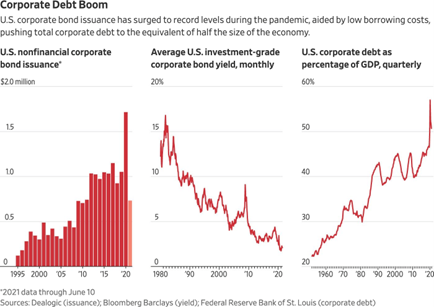
Meanwhile, U.S. companies have $600 billion in corporate debt set to mature this year, a total that will grow to more than $1 trillion a year from 2025 until 2028. Some companies will be unable to replace such debt and will need to meaningfully restructure, either within or outside bankruptcy court, while others merely face substantially higher borrowing costs.
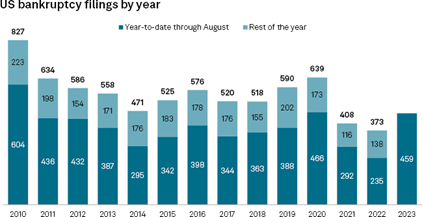
Other data supports this perspective, as there have been 459 corporate bankruptcy filings so far this year through August, nearly double that of last year. 57 companies filed for bankruptcy in August versus 30 in August of 2022. However, when comparing the 2022 data to other years following the Great Financial Crisis, nothing appears out of the ordinary. Or again, are we just waiting for more shoes to drop?
And just as banks are facing the dual headwinds of higher costs of funds and declining loan demand, U.S. regulators, responding to the bank failures earlier this year, announced sweeping rule changes and increased (Tier I) capital requirements in July for all banks with more than
$100 billion in assets. These changes, perhaps well intentioned, will only constrain bank lending activities and market liquidity further, at a time when the markets and borrowers, actual and prospective, will likely need more of it.
Contradiction Number 5: “Higher Inflation is Really Pressuring Treasury Yields”
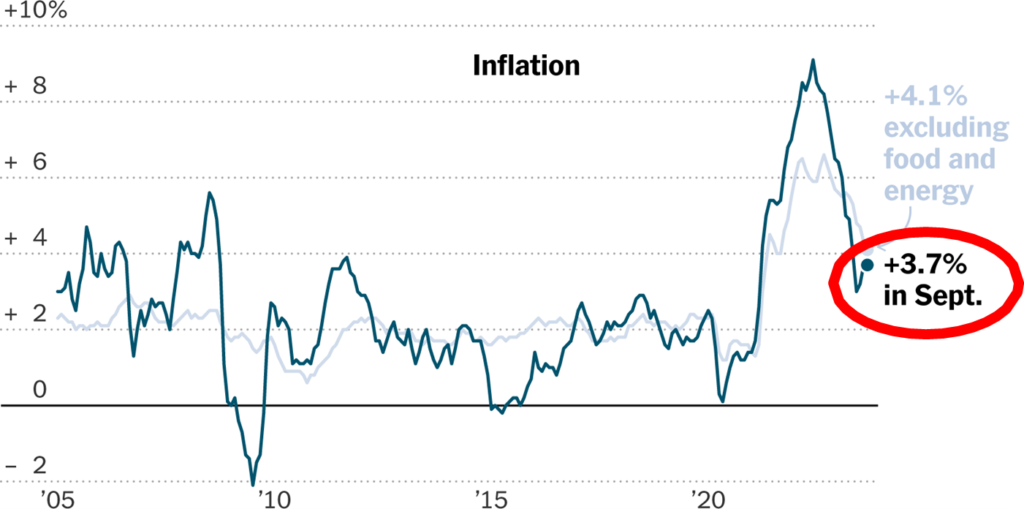
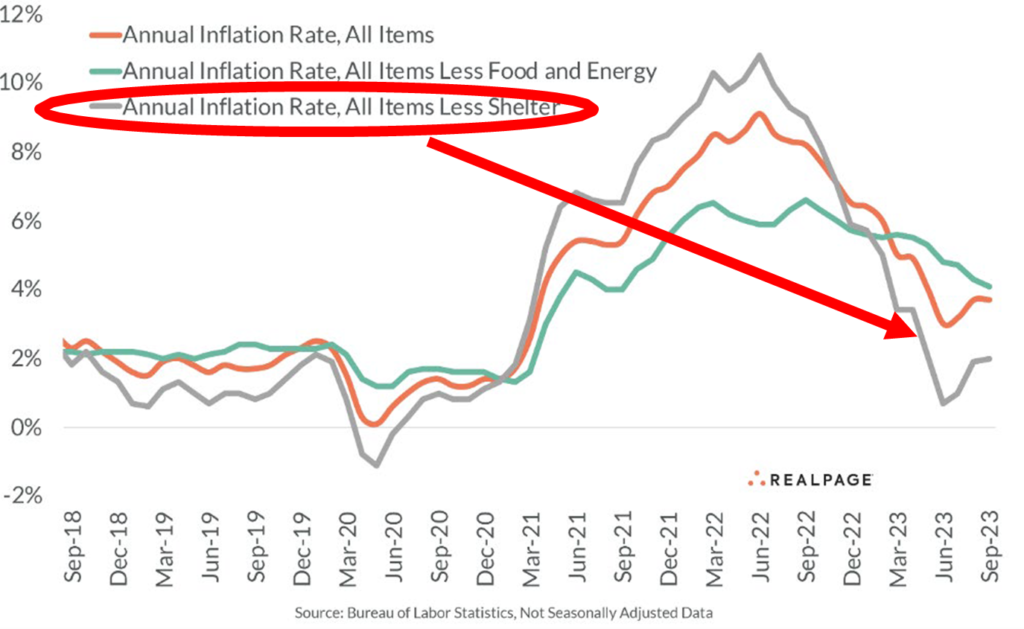
The Consumer Price Index rose 3.7% in September, matching August figures, while the cost of shelter (rent or equivalent and utilities), which comprises the single largest component of consumer prices (about a third), rose 7.2% from a year ago and represented the largest component of September’s inflation figures.
But keep in mind three things. One, inflation exceeded 9% barely over a year ago, so while inflation remains well above the Fed’s two percent target, significant headway has been made. Two, the cost of shelter, again, the single largest component of consumer prices, has a well- documented lag effect (as long as 12 months) and these costs and their impact on reported inflation are likely to decline in coming months, given declines in asking multifamily rents discussed above. In fact, excluding the cost of shelter, consumer prices were up just 2% year- over-year last month. And finally, excluding volatile food and energy prices, consumer prices have actually declined for six straight months.
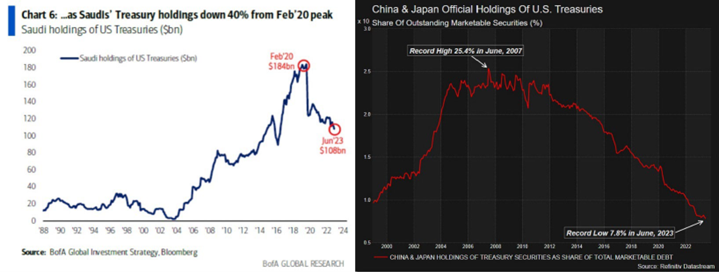
Therefore, it isn’t just inflation that has pressured Treasury Yields, which increased 20% during the quarter. So, what else is causing such a dramatic rise in interest rates, if it isn’t just inflation? The answers lie in several data points and graphs, the first two depicting the Treasury holdings of China, Saudi Arabia, and Japan, three of the largest (if not, the largest) owners of our national debt. In short, they have collectively lightened their Treasury holdings by hundreds of billions this year.
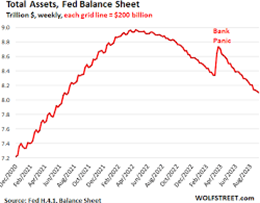
Meantime, the Fed itself, the largest owner of our Treasury Bonds, has lightened its Balance Sheet and Treasury holdings by about $800 billion since last year. You will recall that the Fed mostly acquired them during years of their Quantitative Easing endeavors, principally during the pandemic when they bloated their Balance Sheet by about $6 trillion.
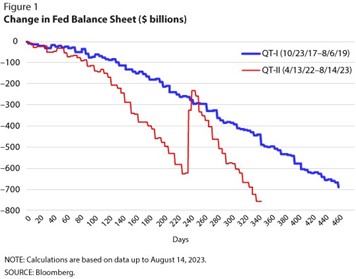
So, why are China, Japan, and Saudi Arabia dumping Treasuries? It is likely a combination of factors. China has a myriad of well documented fiscal challenges and has been dipping into their reserves (i.e., selling Treasuries) to prop up their struggling economy. Japan has had to prop up the Yen in the face of a rapidly increasing U.S. dollar. And Saudi Arabia? Their motivations are
less clear, especially in a market of increasing oil prices. Color me a conspiracy theorist, but I suspect it may have something to do with their desire to pressure the Democratic administration in an election year. This perspective is consistent with their cuts in oil production, pressuring oil prices and requiring the Biden Administration to dip into our strategic reserves to offset higher oil and gas prices.

Finally, let’s not forget ballooning federal deficits, requiring more and more borrowing (and debt service) every passing second. With barely two months left to 2023, the fiscal budget deficit has already more than eclipsed the massive 2022 shortfall. The fiscal 2023 federal deficit will likely be about $2 trillion compared to $1.375 trillion last year, as tax revenues have declined and our national debt has ballooned to $33 trillion, “movin’ on up” faster than when the Jeffersons relocated “to the east side.”
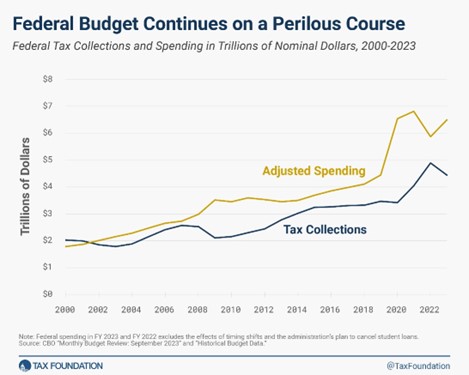
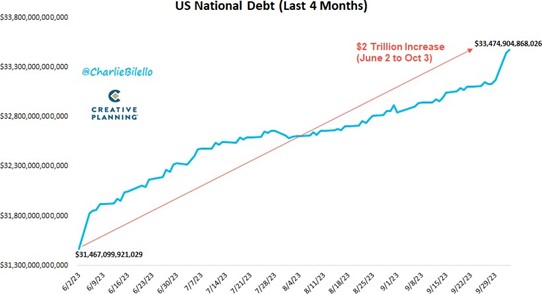
One would think that these trends are simply not sustainable, and I agree. Something has to give as future spending, especially entitlements, is only expected to grow as the Baby Boomers retire and there are not enough young workers around to pick up the slack. The only question is how this plays out…and about that, I am not so sure. Folks have predicted a day of reckoning for so long and yet, those warning calls have not yet materialized in any recognizable way. Maybe it will merely be this way until the end of time, when our galaxy collides with our neighbor, Andromeda, and quadrillions of debt outstanding at that time will simply evaporate.
While Congress Remains in a State of Limbo, as the House Seeks a New Speaker, Local and State Politicians are Picking Up the Slack…as Usual
As usual, I monitor the machinations of government and public policy since they inevitably impact housing markets. In fact, in a single day in July, two articles hammered this premise home. One article addressed yet another effort here in California to place statewide expansion of tenant protections on the ballot, namely a proposition to repeal the Costa-Hawkins Rental Housing Act, which would effectively expand rent control throughout the State. The second involved the City of Maywood here in Los Angeles County, where renters comprise nearly three quarters of residents. Maywood issued a 60-day “rent freeze” in July, which was then extended through the end of September. In a world of climate change and global warming, rent “freezes” are bucking the trend. Coincidentally, on that same July day, the Wall Street Journal ran an article, “High Housing Costs, Evictions Push Homelessness to a Record Increase.”
Meantime, other cities are doing what they do, all trying to rein in higher housing costs, the increasing lack of affordability, and rising homelessness. From Pasadena (Measure H, allowing rents to be increase only once a year and no more than 75% of inflation), to Cudahy (rents can only be increased by inflation or 3%, whichever is less, once a year, and with a 30-day notice), to Bell Gardens (lower of 4% or 50% of inflation, once per year), voters will have some important decisions to make and given basic mathematics, that there are more tenants who vote than landlords who vote, I will go out on a limb and predict that all will pass.
On the other side of the country, New York passed tough new short-term rental regulations in September, which would place restrictions on apartment owners or tenants to lease out units via Airbnb or the equivalent. City Councils in Dallas, Philadelphia, and New Orleans are mulling their own versions of such restrictions.
And, Before we Say Our Goodbyes to Another Quarter and Another Excessively Verbose Quarterly Memo, Let’s Take a Quick Look at Other Goings-On This Past Quarter
- While the Office Market Continues to Struggle Mightily and the Industrial Warehouse Market Softens, Local Neighborhood Strip Centers are Performing Surprisingly Well: According to a recent article in the Wall Street Journal, the “hottest” real estate play these days are local neighborhood strip centers, you know the ones with a donut shop, family-owned grocery store, and ju-jitsu studio. Such centers, owned mostly by certain public REITS like KIMCO, Realty Regency Centers, and Federal Realty, are over 95% occupied at present. Perhaps the increased success of these assets is a result of changing work habits (more at-home or hybrid jobs) or excessive traffic. However, I am not convinced as all three of the just-named REITs are down this year, significantly underperforming market indexes.
Meanwhile, the office market continues to gasp for air, and I could provide numerous examples and macro-level data to hammer home the known reality. Perhaps just a couple quick anecdotes will suffice. One, WeWork warned in early August that it might have to file for bankruptcy. Once worth some $47 billion, the company’s equity is now nearly worthless. Keep in mind that they still lease at least 20 million square feet in hundreds of locations in the U.S. and Canada.
In another anecdote, a real estate private equity firm run by one of Hong Kong’s wealthiest families sold an office campus on the San Francisco waterfront to Blackstone, the country’s largest private landlord, back in 2018, the height of the tech boom, for
$245 million. Now that same firm, Gaw Capital, wants to buy the property back, but at about one-third of its pre-pandemic value, about $90 million. Keep in mind that the outstanding balance of the mortgage encumbering the property approximates $150 million. Ouch.

Finally, the industrial warehouse market, one of the darlings in recent years, has seen some expected softening, in terms of leasing activity, rental rates, and occupancy. The national vacancy rate rose to 4.1% in the second quarter (most recent data), up from 3% last year. However, the national industrial market continues to perform well, despite softer regional figures here in California, for example. The onshoring of key supply chains and increased manufacturing activity in the Southeast are providing tailwinds to the overall market.

- Homelessness and Record-Level Wealth Inequality Continue to Provide Challenges: If a single picture captures a thousand words, it might be this particular data set, which summarizes wealth inequality by country, and it won’t surprise you to learn who leads the pack, so to speak. Wealth inequality in the U.S. has never been higher with the chasm between the haves, the have-less and the have-nots, continuing to widen.
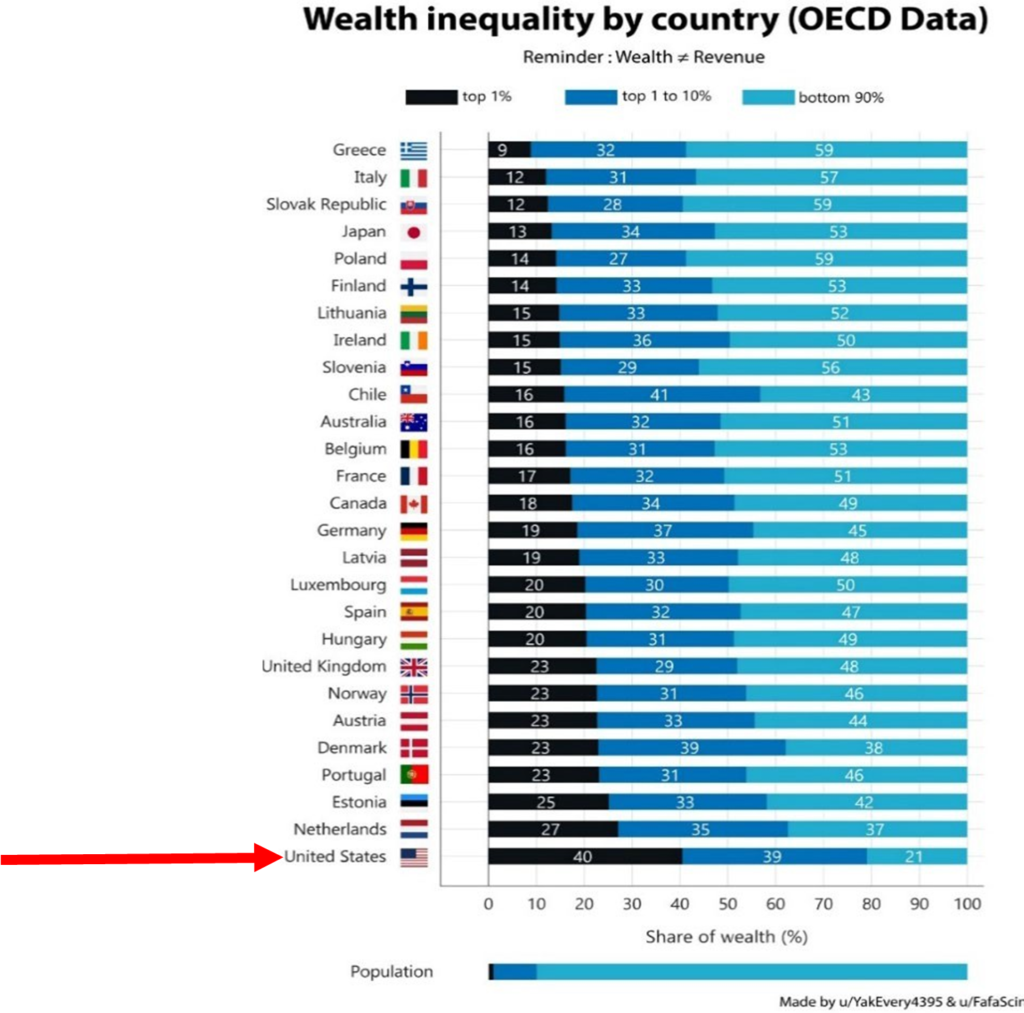
From another perspective, the delta between CEO compensation and that of a typical worker has never been wider. In the most recent data, from 2021, CEOs made nearly 400 times an average or typical worker. Yowza! My recommendation is that if you are ever offered a CEO job, take it.
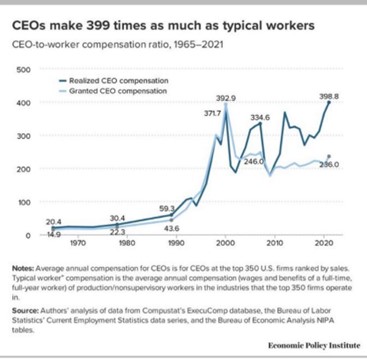
In any event, this relationship is nothing short of eye-popping and cannot be healthy, likely leading to increased homelessness, economic and political divisiveness, and other unfavorable demographic changes.
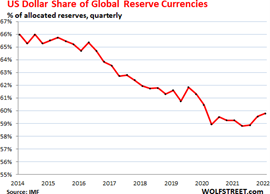
- · The U.S. Dollar is On a Roll: A couple of quarters ago, I wrote about how concerns surrounding the future of the U.S. dollar as the principal fiat currency were overblown and that for any number of reasons, the dollar was and is not at risk of losing its global status to the Yuan, Rupee, Bitcoin, or Susscoin despite understandable concerns. While the amount of U.S. dollars in foreign exchange reserves has declined since the end of 2000, the dollar has strongly rallied this year, in the face of increased global uncertainty and higher U.S. interest rates.

- China is in a World of Hurt: When I visited China back in 2017, it seemed like the country could do no wrong, at least economically, and had an extraordinary future, likely to become the global GDP leader within a few decades. My, how things have changed, and in just five or six short years. China’s population declined last year for the first time in 80 years. Two of their largest real estate companies, Evergrande and Country Garden, have imploded, and more are likely to follow. Those Chinese under 25 years of age are unemployed in staggering numbers, with a related unemployment rate of at least 25%. We can’t be sure, since China simply stopped publishing unemployment figures, as though that would help. And while we worry about inflation, China has experienced deflation in 2023, though such deflationary pressures have recently eased.
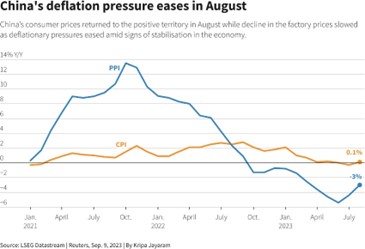
This is not something to necessarily celebrate, as China lightens its ownership of our Treasuries, as discussed above, and their challenges only add to global uncertainty.
In the face of so much uncertainty – economic, financial, political, and geopolitical – forecasts are no easy matter and recent horrific events in the Middle East, which should be universally condemned, only add to market risks
At the beginning of 2023, nearly 60% of surveyed economists predicted that the U.S. would enter a recession during the next year. Then, as data came in, those dual-handed economists did what they do so well. They changed their forecasts, because while some data pointed to a slowdown, if not a recession, “on the other hand…”
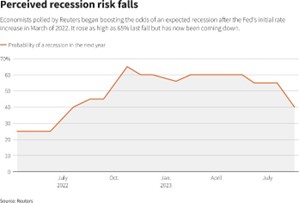
Will Jerome Powell and the Fed be able to engineer that proverbial “soft landing,” to thread that needle I thought was virtually impossible? Thus far, the answer seems “yes,” or it seems possible. Recent GDP, employment, and earnings data suggests that any recession is still aways away. Granted, consumers and investors are a fickle bunch, so things can change quickly.
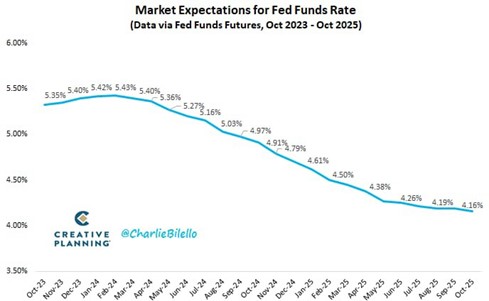
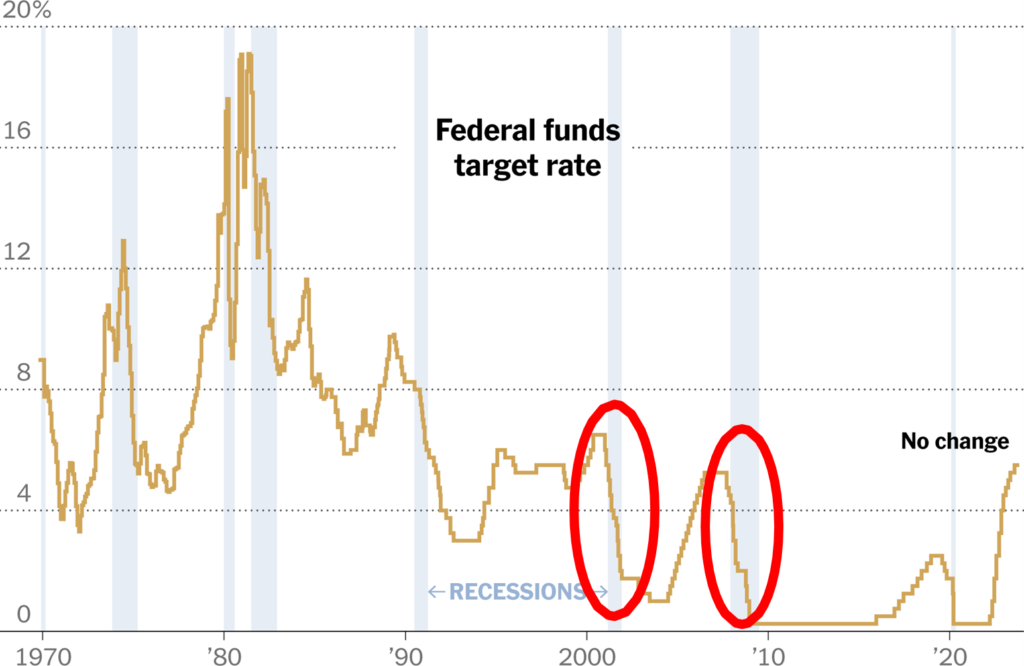
History tells us that when economies soften and the Fed has to provide stimulus, they do so in fairly dramatic fashion. That is, if one examines expectations regarding interest rates, captured by the Fed Funds forward curve, it looks smooth, with rates declining in a fairly linear fashion between 2024 and 2025.
However, history looks quite different. That is, when the Fed cuts rates, they usually do so quickly and dramatically in response to a more sudden and significant downturn.
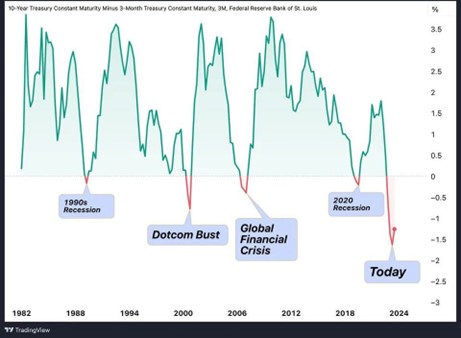
Meantime, there is seemingly no consensus among market pundits and economists, while there are plenty of warning signals. I started this memo with the yield curve, which remains inverted,
with short-term interest rates exceeding longer-term ones. This phenomenon has predicted something like 12 of the last five recessions, according to market observers and comedians. That is, it can and often is, a false negative. Similarly, if one compares the spreads between 10-year and three-month Treasuries, you get an ominous picture like this, which is scary, and definitely worthy of the Halloween season:
Maybe that’s real takeaway. There is no consensus about nearly anything and everything, and conflicting and contradictory data is not hard to find. These markets offer the economic equivalent of the Chinese game, Go.
Finally, while I generally avoid any sort of political discussions in these quarterly memos, other than commenting on policies that impact real estate, I feel compelled to comment briefly about recent events in the Middle East. My heart goes out to all impacted, including some of my family members. However, as a long-time faculty member at UCLA, I am profoundly disheartened by the antisemitism we have witnessed not just at UCLA, but on campuses throughout the U.S. (and beyond). I have also been troubled by the obvious equivocating by university leaders, who have mostly been unwilling to unambiguously condemn acts of terrorism and inhumanity, seemingly unable to articulate and reconcile competing thoughts simultaneously out of some inexplicable fear of upsetting or offending others.
Let me be clear. It should never be hard or controversial to call out and condemn inhumanity and terror, exactly what Hamas has done. We should collectively agree that murdering, assaulting, and kidnapping civilians is unacceptable, full stop. At the same time, it is not unreasonable to question what sort of response from Israel is appropriate when so many other civilians (Palestinians) will be impacted. What does a “proportionate” response mean? What might be the consequences of an Israeli response, in the short-, intermediate-, and long-term? Will more hatred and terrorism be fomented?
I don’t know the answers to such complex ethical questions, but too many university presidents (and others) have issued namby-pamby responses, trying to placate everyone through careful wordsmithing, but instead, offend many, including yours truly. The bottom line is that empathy should be an unwavering moral compass and principled leadership should not be a theoretical construct.
As always, I want to express my gratitude and thanks to each of you: our investors, supporters, employees, partners, vendors, or just those of you who somehow are here just to read my verbose quarterly memos. Thank you. I know these are trying times and there will be continued challenges in the markets and certain assets in our portfolio, unavoidable realities of this particular market and market cycle. Rest assured we will give all we have to navigate them.
We continue to evaluate potential acquisition opportunities when they cross our desks, though deal flow remains anemic. We continue to raise capital for the three-asset portfolio in the Inland Empire (IE3), which has exceeded projections since we acquired it. I hope you might take a look before we end the fundraise at the end of the year. We will continue to pursue attractive acquisition opportunities, though they are certainly not easy to find (bid-ask spreads between potential buyers and sellers remain wide), and transaction volume has declined substantially, consistent with data I provided earlier.
Please feel free to reach out to me or a member of our investor relations team (Tania Mirchandani, myself, or Christopher Serna, who just joined our firm) about any questions you might have about your investments or the IE3 opportunity. Aimee DeFord recently transitioned to a different role within our property management firm, Clarion Management, and I want to express my appreciation for her exceptional efforts these past couple of years.
Best,

Eric Sussman
Managing Partner
LEGAL DISCLAIMER:
Clear Capital, LLC obtains information contained in our newsletter from sources we believe to be reliable, although we cannot guarantee its accuracy. NEITHER CLEAR CAPITAL, LLC, NOR ITS RESPECTIVE AFFILIATES, PRINCIPALS, EMPLOYEES, OR AGENTS SHALL BE LIABLE TO ANY USER OF THIS REPORT OR TO ANY OTHER PERSON OR ENTITY FOR THE TRUTHFULNESS OR ACCURACY OF INFORMATION CONTAINED HEREIN OR FOR ANY ERRORS OR OMISSIONS IN ITS CONTENT, REGARDLESS OF THE CAUSE OF SUCH INACCURACY, ERROR, OR OMISSION. The opinions expressed in the newsletter are those of Clear Capital, LLC, and may change without notice. The information in our newsletter may become outdated and we have no obligation to update it. The information in our newsletter is not intended to constitute individual investment advice and is not designed to meet your personal financial situation. It is provided for information purposes only and nothing herein constitutes investment, legal, accounting or tax advice, or a recommendation to buy, sell or hold a security. No recommendation or advice is being given as to whether any investment is suitable for a particular investor or a group of investors. It should not be assumed that any investments in securities, companies, sectors or markets identified and described will be profitable. We strongly advise you to discuss your investment options with your financial adviser prior to making any investments.
Clear Capital, LLC reserves all rights to the content of this newsletter.

