


“If the road is easy, you’re likely going the wrong way.”
-Terry Goodkind
“In a crisis, don’t hide behind anything or anybody. They’re going to find you anyway.”
-Bear Bryant
In recent years, universities across the country have been wrestling with student requests for what are known as "trigger warnings," explicit alerts that the material they may read, see, or hear as part of a course curriculum might upset them or cause excessive or unwarranted stress. Thus far, after nearly 30 years at UCLA, I have yet to provide any such warnings in my accounting and real estate courses and I do not anticipate doing so in the future. For better or worse, prospective students will just have to prepare themselves in other ways for the discomfort they will inevitably feel when I subject them to discussions about housing policy, a dreaded cold call, and/or a less than fashionable shirt from Jos. A. Bank or Kirkland (as though one exists).
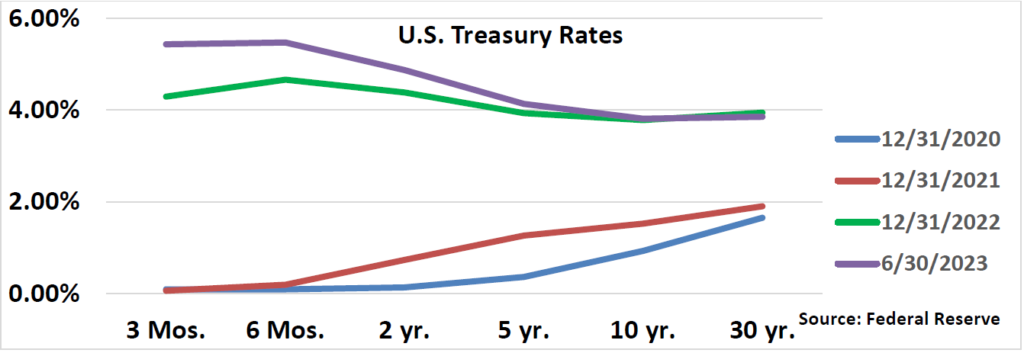
However, as I delve into the second quarter real estate and financial markets and some views about what might lay ahead, please be warned that my opinions, observations, and perspectives may induce nausea, abdominal pain, and/or constipation, essentially the same potential side effects one might experience from taking Ozempic or watching the Mets this season. Here is the upshot. During the first quarter of 2023, longer-term interest rates declined from the end of 2022, providing optimism that the Fed’s unprecedented and aggressive efforts to combat inflation had been successful and that they would return to more accommodative policies in 2024, if not earlier. Such would be beyond welcome to commercial real estate participants.
Unfortunately, this optimism was dashed during the second quarter, as inflation - especially the cost of food, housing, energy, and Taylor Swift tickets - remained stubbornly persistent, and interest rates reversed course, which in large part led to the mid-quarter failure of First Republic Bank (May 1st), the second largest in U.S. history ($229 billion in nominal assets) and a growing number of foreclosures, principally in the office market. In turn, the MOVE index, which measures interest rate volatility, has spiked.
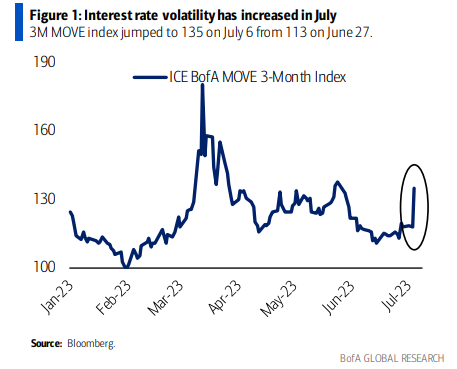
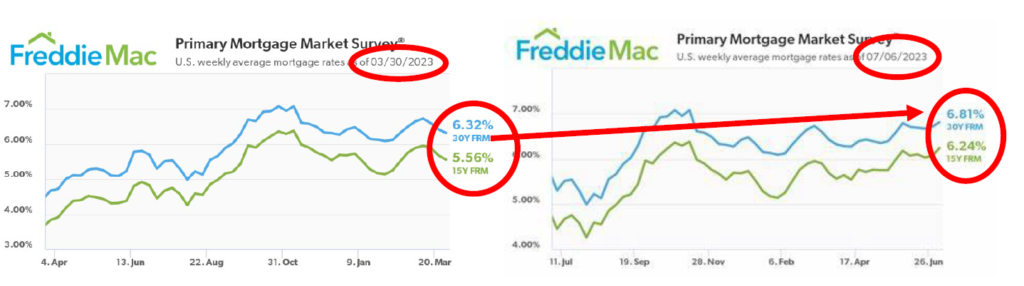
In fact, between June 30th and July 7th, the yield on 10-year U.S. Treasury bonds increased from 3.81% to 4.06%, only to reverse course and decline to 3.83% one week later, on July 14th. Rates on 30-year mortgages increased from 6.32% at the end of the first quarter to 6.81% at the end of the second, and by the end of last week neared 7.0% (6.96%). Two-year Treasury yields ended the second quarter at 4.88%, up from 4.06% at the end of March. And at last glance? 5.04%. Such sharp increases in rates not only reduce the values of bonds and commercial real estate, at least on paper and perhaps temporarily, but add to investor and lender uncertainty.
This reversal and increased volatility in interest rates foretell challenges for the commercial real estate industry and its participants, from lenders to principals and sponsors to other service providers (e.g., mortgage bankers/brokers, escrow/title officers, property/asset managers). In short, the next couple of years will likely be a slog, as owners and sponsors work through the stresses caused by higher costs of capital, tightening liquidity, and increased uncertainty. Of course, we have already witnessed significant dislocation in the office and retail sectors, with a large number of foreclosures and failures experienced from coast to coast…and sometimes in-between. According to a new report from MCSI Real Assets, some $64 billion of commercial real estate is now distressed, while more than $150 billion is “potentially troubled.”
Moreover, previously “hot” segments of the commercial real estate space – multifamily (including student and senior housing), industrial, and data centers – while having far better underlying fundamentals, are not immune and increased delinquencies, notices of default, and foreclosures in these sectors are inevitable. In many cases, the problem is not and will not be the real estate itself - rents, occupancy rates, and/or pre-debt cash flow - but merely untenable capital structures and excessive leverage in a higher rate environment. In fact, while the Clear Capital portfolio continues to mostly track forecasts and operating cash flow projections, it is the debt, especially that which is floating rate (even hedged), which is proving challenging, especially for legacy assets. On paper, nearly all commercial real estate values are probably down anywhere from 15 to 30%, merely from increases in interest rates. While perhaps temporary, these unrealized losses are not without consequence.
In fact, earlier this year, Veritas, San Francisco’s largest landlord, defaulted on a huge loan (at least $448 million) encumbering nearly 2,500 apartment units in ninety-five different buildings throughout the city. The largest mortgage loan (non-performing) being shopped secures a 75-building portfolio consisting of 2,149 rent-controlled units and forty-five commercial spaces, mostly ground-floor retail. The locations are generally good, and we are talking about San Francisco, though the city has been plagued by homelessness, a softening technology market, and a flight of retail and white-collar office workers, as has been widely publicized.
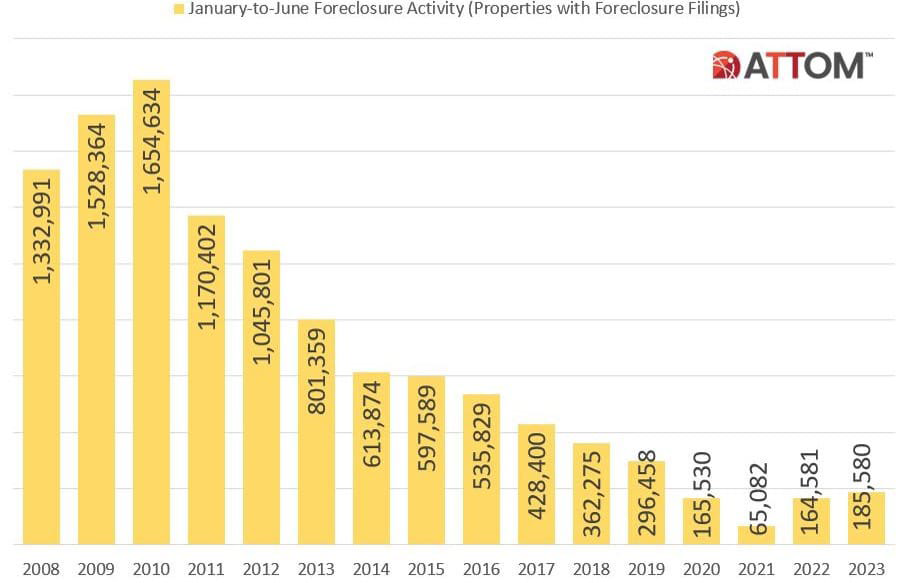
While foreclosure activity during the first half of 2023 pales in comparison to that experienced in the Great Financial Crisis, foreclosure activity has picked up in recent months and I sense we are still in the early stages of this cycle, which will likely have a long(er) trough. These realities should present potentially attractive investment opportunities and we are excited about our recent acquisition of the “IE3,” a portfolio of three assets in the Inland Empire. However, with less liquidity, higher cost of capital, and more conservative underwriting, closing on even appealing opportunities won’t be a slam dunk. Fear and uncertainty are unwelcome bedfellows to acquisition endeavors.
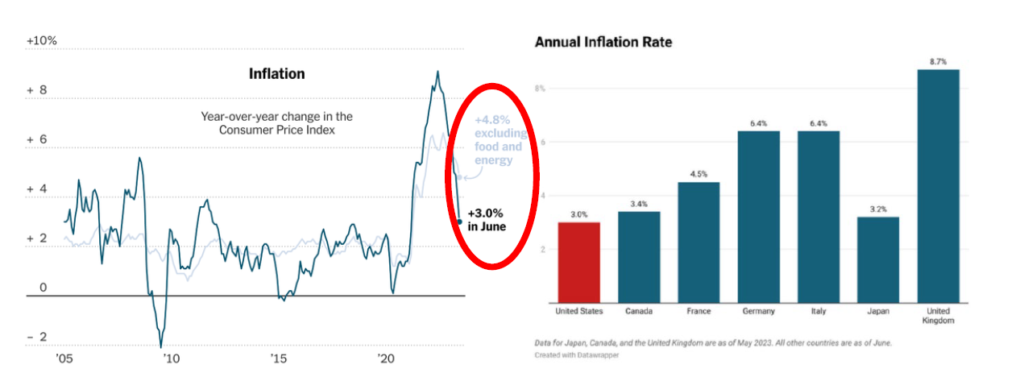
And inflation data itself? Both consumer and producer prices have moderated, with inflation declining for eleven straight months. The Consumer Price Index was up 3.0% in June (4.8%, excluding food and energy costs), year-over-year, versus a whopping 9.1% a year ago. The U.S. now has the lowest inflation rate among developed nations, despite the political rhetoric.
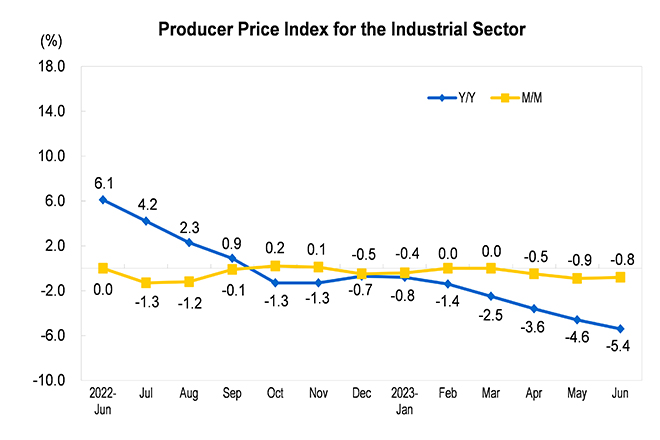
And producer prices? The June Producer Price Index was down 0.8% between May and June, and 5.4% from June 2022 to June 2023. Producer prices have declined even faster than consumer inflation, so inflationary pressures are definitely easing. However, the Fed’s two percent inflation target still seems aways away.
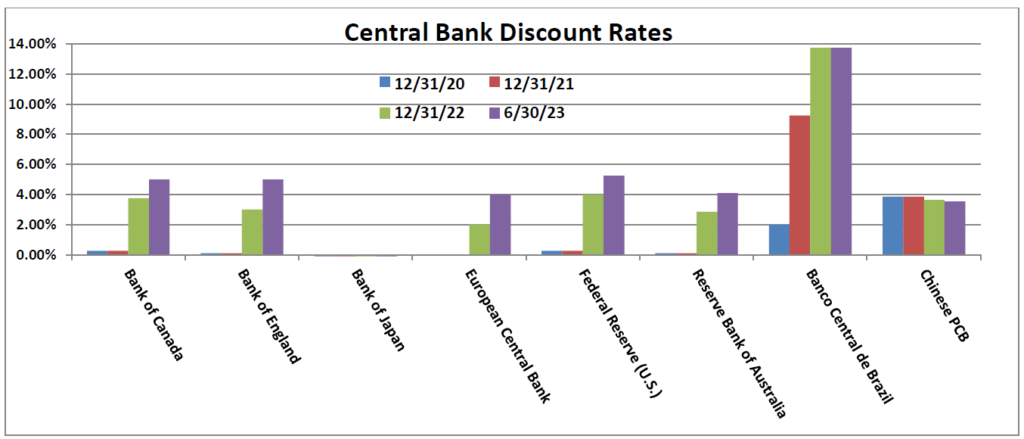
Regardless of moderating inflation, June witnessed the world's major central banks delivering the largest number of monthly interest rate hikes year-to-date, surprising investors and signaling the possibility (if not probability) of more tightening ahead as policy makers grapple with inflationary pressures. Seven of the nine largest central banks hiked rates last month, while two opted for no change (including the U.S.). Both Norway and the Bank of England increased rates by a larger-than-expected fifty basis points, while Canada and Australia also resumed their rate hiking ways. Sweden, Switzerland, and the European Central Bank also tightened, taking the collective tally of rate hikes to 225 basis points last month. May witnessed six rate hikes. Across the entire G10 (group of eleven industrialized nations), there have been twenty-eight rate hikes this year, totaling 950 basis points, and since Norway started raising rates in September of 2021, major central banks have increased rates by a combined…3,765 basis points. Yowza.
The increase in rates and the specter of persistently higher inflation are probably the biggest news stories of the quarter, narrowly beating out the discovery of a small bag of cocaine in the White House (wasn’t mine, I swear), the departure of Pat Sajak as host of Wheel of Fortune, the tragic Titanic submarine implosion, a failed coup (or whatever the heck that was) in Russia, and the predictable (if not unnecessarily politicized) conclusion of debt ceiling negotiations closer to home.
Regardless, conflicting data appears around every corner, making economic, financial, and market predictions about as difficult as interpreting Mona Lisa’s beguiling smile or anticipating the winner of an Elon Musk-Mark Zuckerberg cage match. Analyst estimates of global GDP are wide, twice the range of predictions made in previous years, and the word “uncertainty” appears more than sixty times in the most recent International Monetary Fund’s Global Economic Outlook. One day the Dallas Fed Chief, Lorie Logan, says that interest rates should rise further, and then, on the very next day, Fed Chief Jerome Powell says something far less hawkish. These conflicting narratives remind me of that memorable scene from 1982’s Fast Times at Ridgemont High, when Sean Penn (or rather, his character, Jeff Spicoli) responds to a friend after totaling this friend’s brother’s new Camaro and the friend’s subsequent admonition…’My brother is going to _hit! He’s going to kill us!’ to which Spicoli replies, ‘Make up your mind, dude! Is he going to _hit or is he going to kill us?’
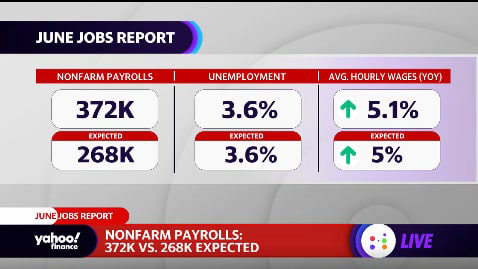
Let’s start with the job market, since the Fed is tracking this data closely in setting interest rate policy. In short, it remains surprisingly robust, rekindling fears of persistent inflation and higher interest rates. In June 372,000 new jobs (non-farm) were added versus the 268,000 expected. Wages increased 5.1%, year-over-year. Despite the odds, the U.S. labor market continues to add jobs and even companies in the crosshairs of rising interest rates are holding onto or adding workers. Builders, architects and engineers, real-estate agents, vehicle manufacturers and other businesses typically sensitive to higher borrowing costs have actually increased employment levels this year, though I sense this may reverse in the coming months.
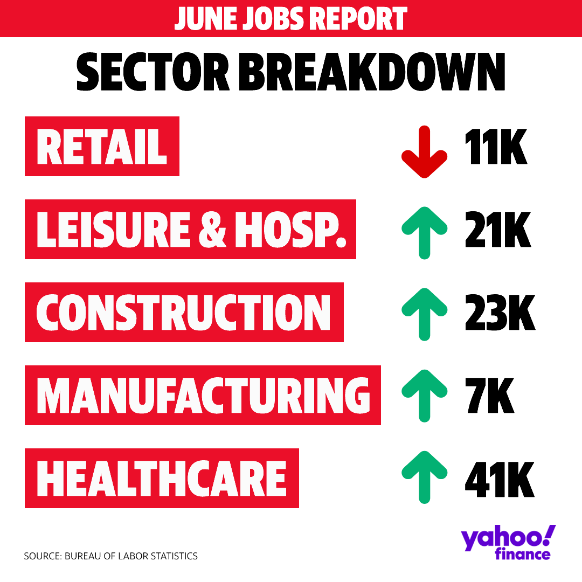
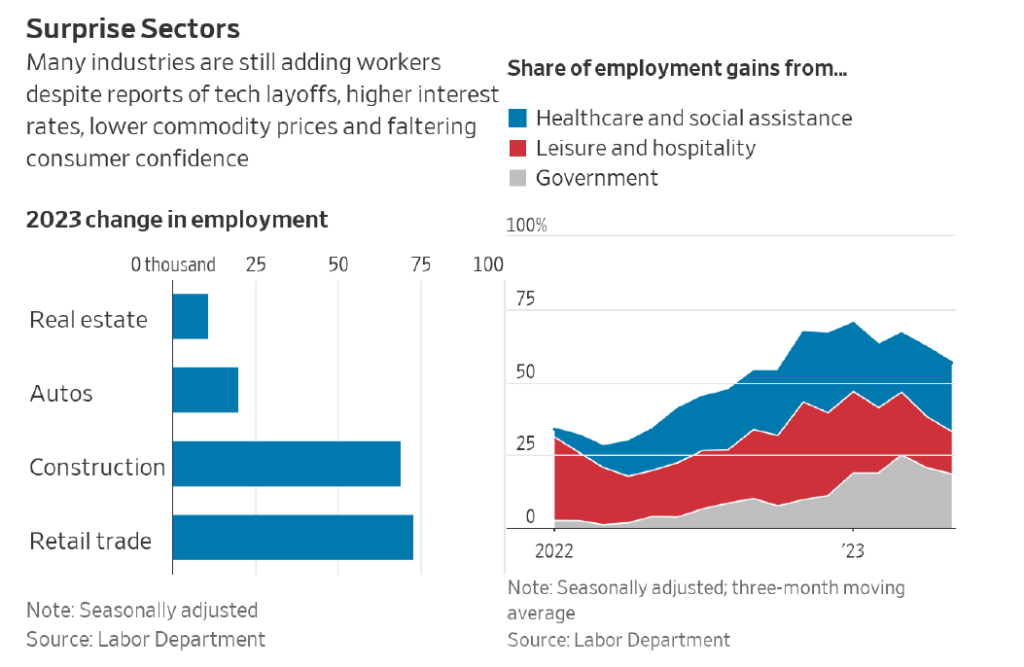
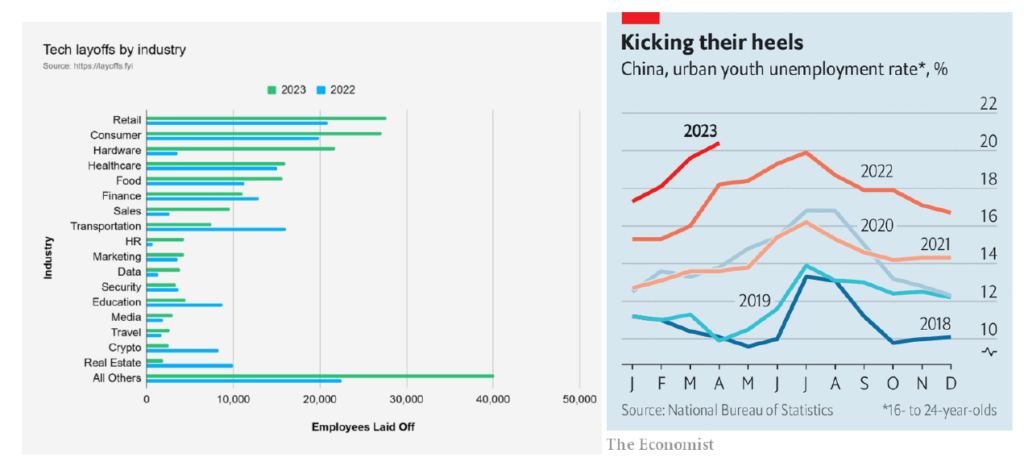
These job gains, along with much larger increases in industries still trying to claw back workers lost during the pandemic, have added up to almost 1.6 million new jobs in the first five months of 2023, outpacing forecasts. Meanwhile, other firms continue to reduce headcounts. Although merely an anecdotal (and unsubstantiated) data point, I heard a rumor that a surprisingly large number of MBAs from UCLA Anderson did not have job offers at graduation time last month as traditional recruiters in tech (largest hirers in recent years), finance, consulting, and real estate have pared back hiring needs. Other firms have pushed back start dates. On a somewhat related note, I recently read that the jobless rate among Chinese 16- to 24-year-olds rose to a whopping 21.3%, compared to 7.5% here in the U.S. Yowza, again.
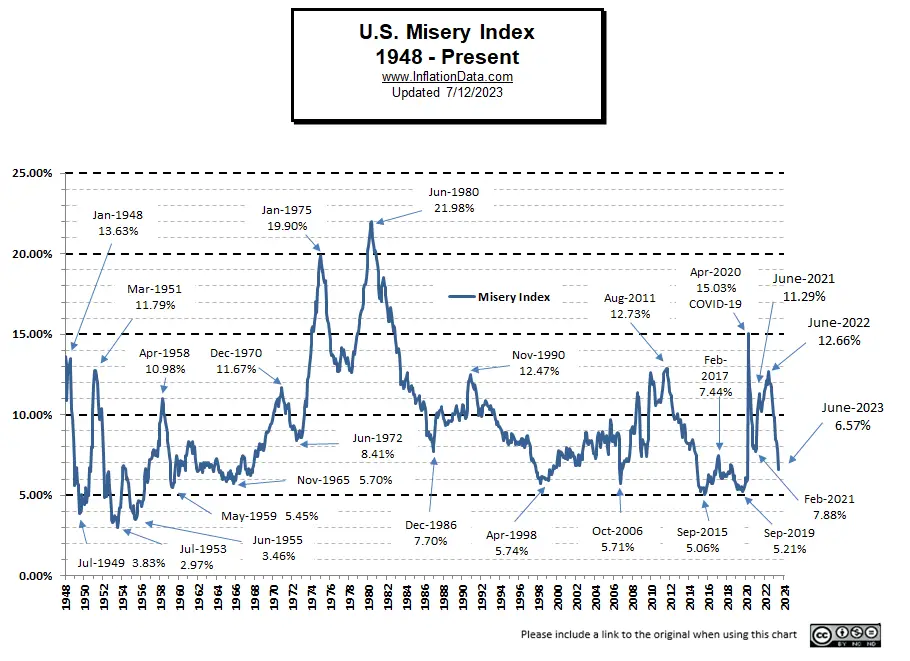
Meantime, the so-called, but appropriately monikered “Misery Index,” computed by adding the previous 12-month change in the Consumer Price Index percent change and the unemployment rate, has been trending downward, to a recent 6.57% in June. The last time the Misery Index was this low was before Covid, in September 2019. So, would someone please tell me why I don’t feel better…or at least less miserable?
How about the equity markets? Well, the S&P 500 is up 17.4% this year, with the tech-heavy NASDAQ gaining a whopping 34.9% thus far, its best first half in 40 years. If you compare the equity markets between 2009-2010 and 2022-2023, they look eerily similar, with a significant downturn followed by a reversal the following year.
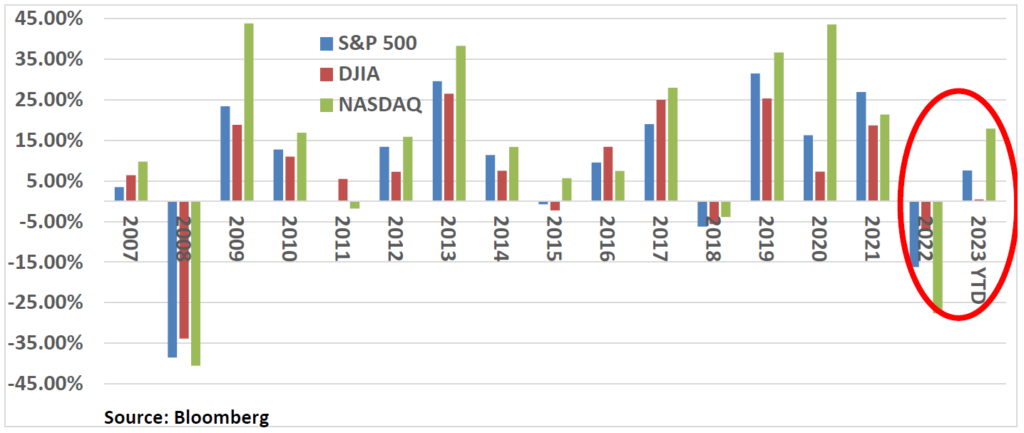
However, when we peek under the equity market hood, there is more (or less) than meets the eye. In fact, when I recently read a headline that the S&P 500 and NASDAQ had reached their highest levels since last August and that the price rise was almost enough to represent a “bull market” (generally defined as a 20% rise in the S&P 500), I did a double take. Bull market? Really? This has to be the least fun and exciting bull market I have ever experienced.
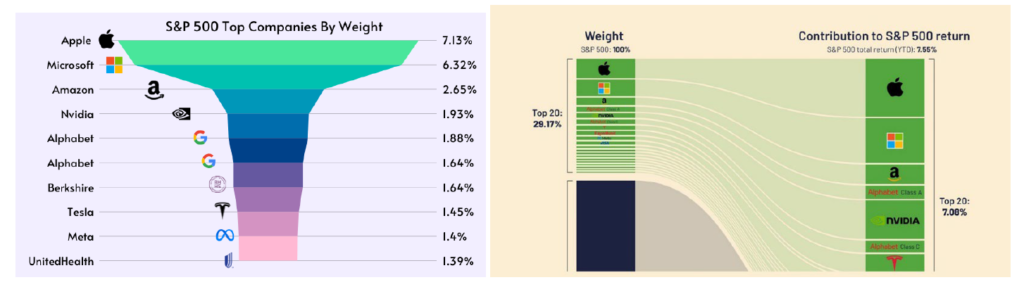
And no wonder. This “bull market” has really been powered by a small number of mega-cap tech stocks: Apple, up 38% this year. Nvidia, up 165%. Tesla, 128.5%. Meta (Facebook), 151.5%. In fact, just twenty stocks, including the likes of Apple, Microsoft, Amazon, Nvidia, Alphabet (Google), Meta, Berkshire Hathaway, Tesla, and United Health, represent over 90% of S&P 500 returns through May, despite comprising less than 30% of the Index. In fact, on Friday of last week, Nvidia’s stock price moved up and down so substantially in a single day that the implied value of the intraday swing (change in market value) was larger than the market capitalization of four hundred other companies in the S&P 500. That’s just nuts. Another “yowza” seems warranted.
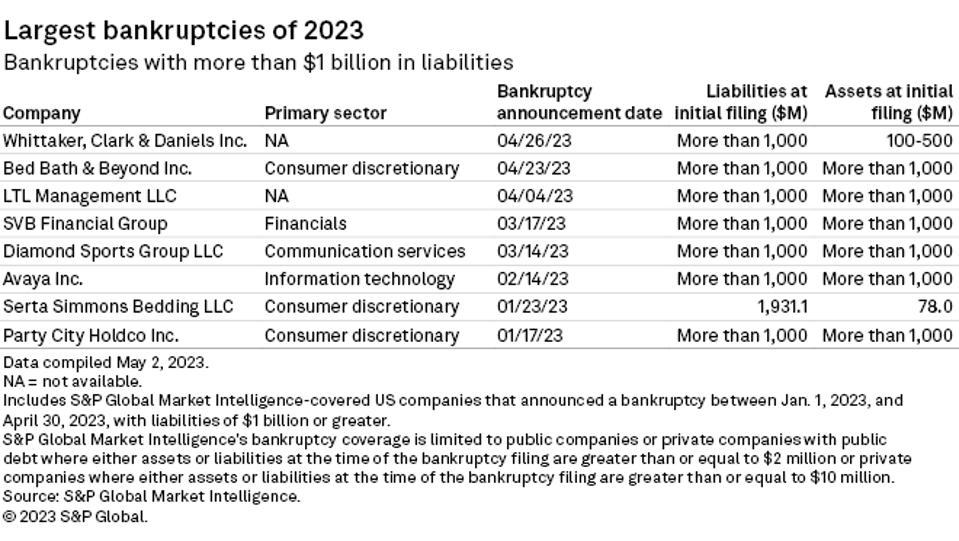
Meantime, corporate defaults rose last month, with forty-one in the U.S. so far this year, more than double the same period last year, according to Moody’s. Heavy debt loads, high interest rates, and uncertain economic conditions are beginning to take their toll. The number of bankruptcy filings in the U.S. this year has also sharply risen to levels not seen since 2010. Through June, there were 324 bankruptcy filings, not far behind 2022’s total of 374, according to S&P. The list of failures includes Silicon Valley Bank and Bed Bath & Beyond, of course, but others like regional sports network owner, Diamond Sports, and the information technology firm, Avaya.
And how about the residential real estate markets, both single- and multifamily? How are they holding up in these challenging markets?
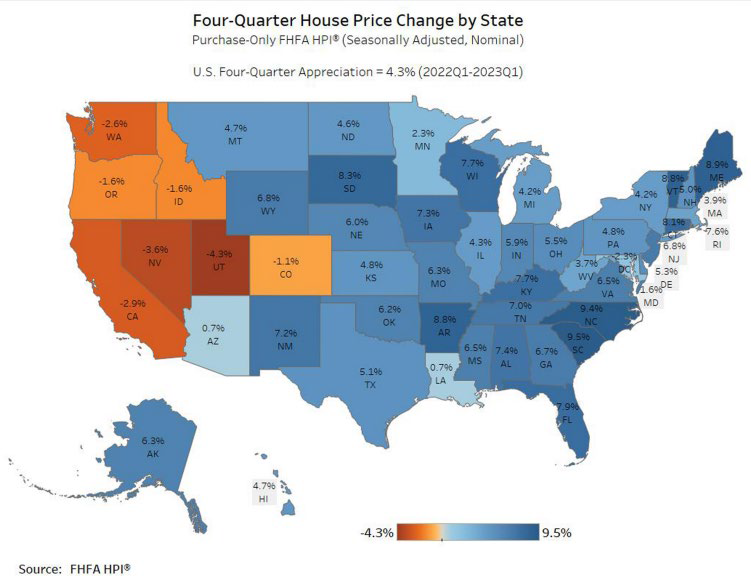
In a word, “resiliently,” with single-family prices up 2.0% nationally for the year ended April, representing 135 straight months of higher prices. That is not a typo. While individual markets may be struggling (e.g., Bay Area, Denver, Phoenix, Los Angeles), the overall market remains in decent shape and prices firm. Perplexed, the New York Times recently posed a rhetorical question in an article captioned, ‘What is Happening in the Housing Market?’ trying to explain how housing prices have not dropped despite the extraordinary increase in interest rates.
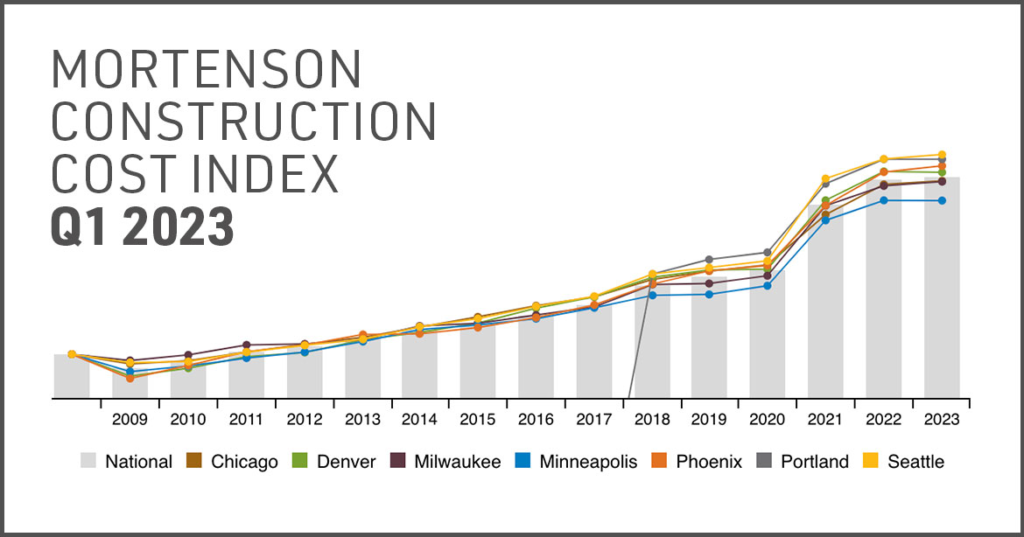
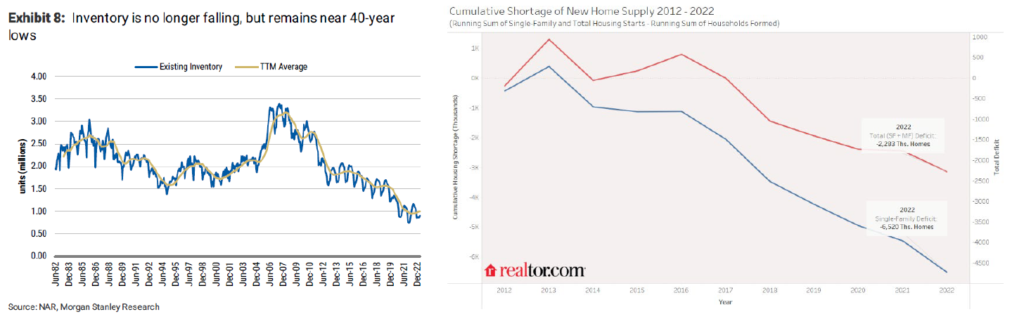
The answers are fairly simple. Record-low supply tops the list, as inventory hovers near 40-year lows. Baby boomers, with their trillions of equity in homes, ain’t selling. Folks who own or bought homes in recent years, with mortgage rates of 3.0% or less, ain’t selling. And builders can only build so many homes, with constraints on everything from buildable lots, available labor, raw materials, along with (of course) higher construction and borrowing costs, at least for smaller, privately-owned builders who cannot easily access the capital markets.
While more than 23,000 Alternative Dwelling Unit (ADU) or “Granny Flat” permits were issued in California last year (versus 5,000 in 2017), following the elimination of R-1 zoning in the state, the overall impact represents that proverbial drop in the bucket. The fact is that newly built homes represent about a third of all homes for sale in March, about double historical norms.
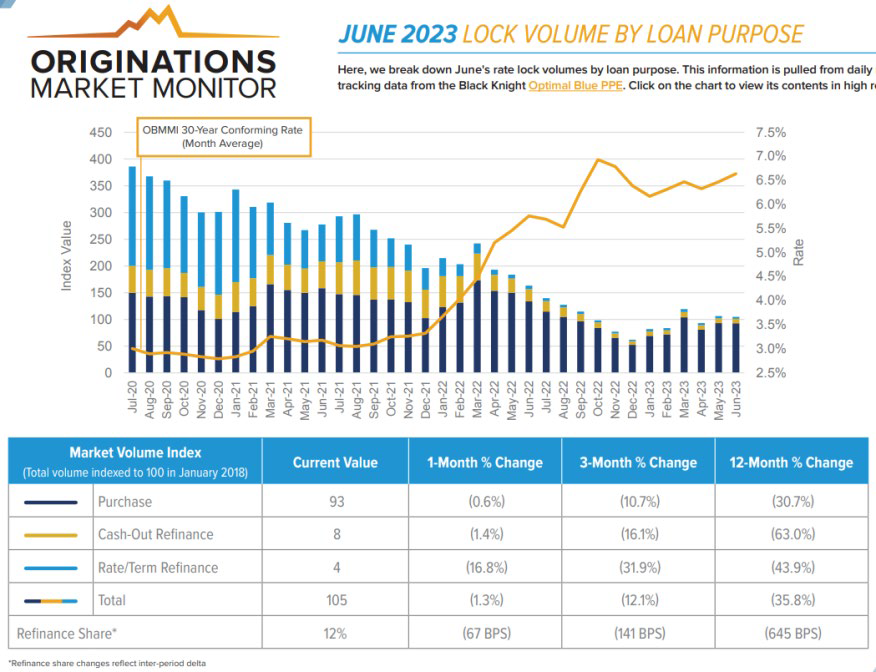
Some buyers, perhaps recognizing that waiting for a significant price drop in home prices is indeed akin to “waiting for Godot,” have decided not to wait any longer. Institutional and foreign buyers are also reliable sources of demand, albeit at reduced levels from previous years. In fact, while prices are firm, sales volumes are down sharply, as are mortgage applications.
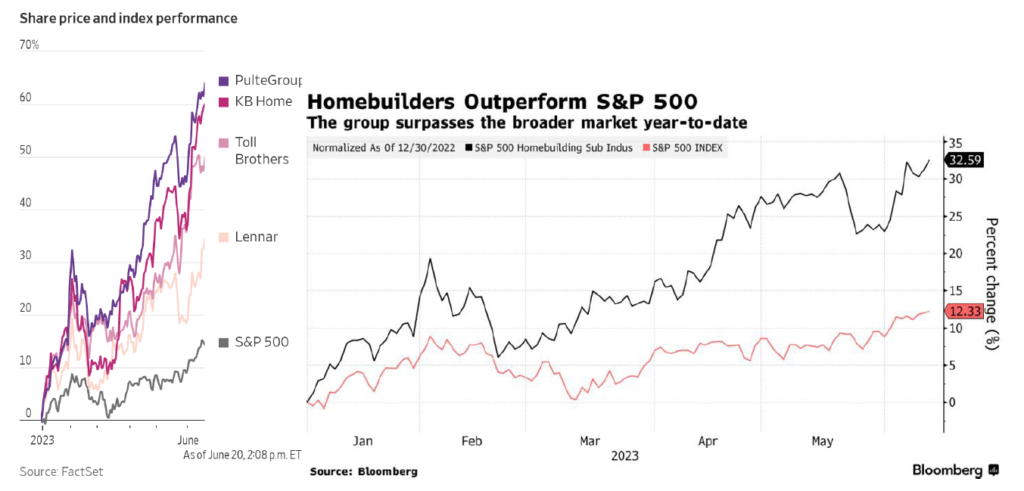
Meanwhile, homebuilders have been one of the hottest sectors in the equity markets thus far in 2023, defying all expectations and all the economic headwinds and higher rates. For example, KB Home is up over 24% this year and over 79% in the past 12 months, something I would never have predicted. Another “yowza” seems more than apropos. The entire homebuilding sector is up nearly 33% in 2023, more than double the return of the S&P 500. Yeah, those homebuilder stocks sure are boring. #sarcasm
Ironically, the apartment market has not fared quite as well in recent months, as rent growth has stalled. The average of six national rental-price measures from rental-listing and property data companies indicates that asking rents for new leases rose just under 2% over the 12 months ending in May. One of the rent measures, courtesy of Redfin, indicates that rents for both apartments and single-family rental homes, actually declined 0.6% in May, year-over-year. A decline in asking rent over a 12-month period had only happened one other time since the Great Financial Crisis, when the rental market briefly declined in 2020 because of Covid-19, ending a decade-long streak of rent growth. However, while data providers agree on the direction of multifamily rents, they do not necessarily agree on the precise figures themselves.
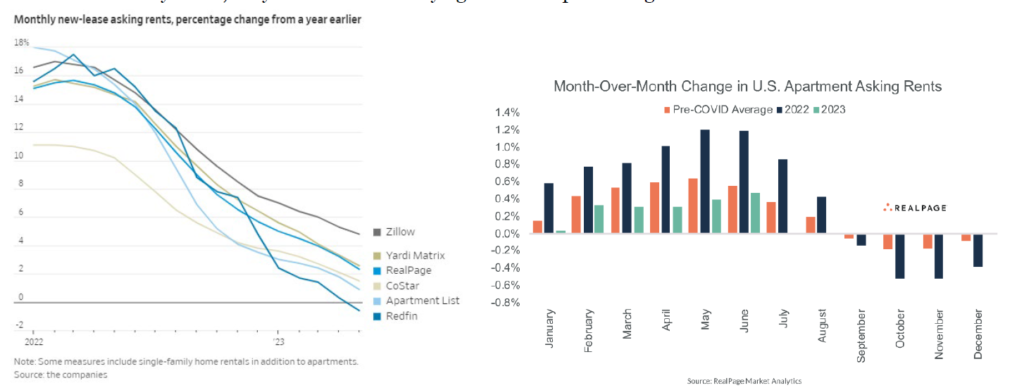
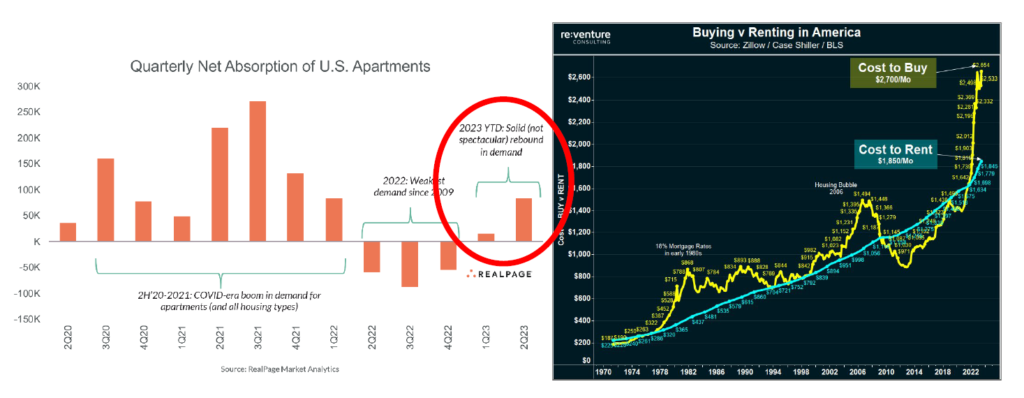
There are a couple of silver linings. One, absorption for multifamily units (excess of unit leasing activity above new supply) and demand are picking up. Two, affordability challenges continue to benefit apartments over single-family residences, making the renting decision more compelling. According to Realtor.com, the median home price in the U.S. was $445,000 in June, versus $441,000 in May. Combined with mortgage rates of around 7%, the monthly “cost to buy” is at least 40% higher than to rent.
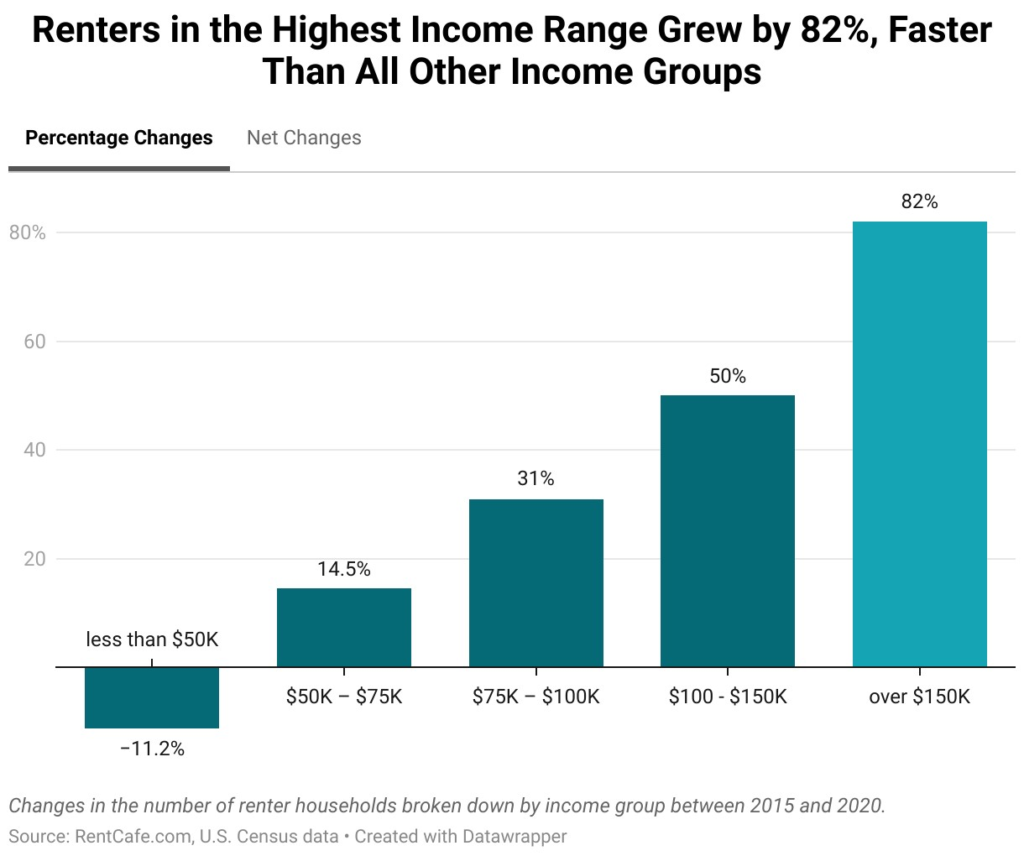
According to a number of articles I have recently read, higher income individuals and families are choosing to rent, perhaps also preferring the extensive amenities and flexibility provided by high-end multifamily units. Renters in the highest income range (household income over $150K per year) grew by over 80% between 2015 and 2020 (most recent data available), according to RentCafe.
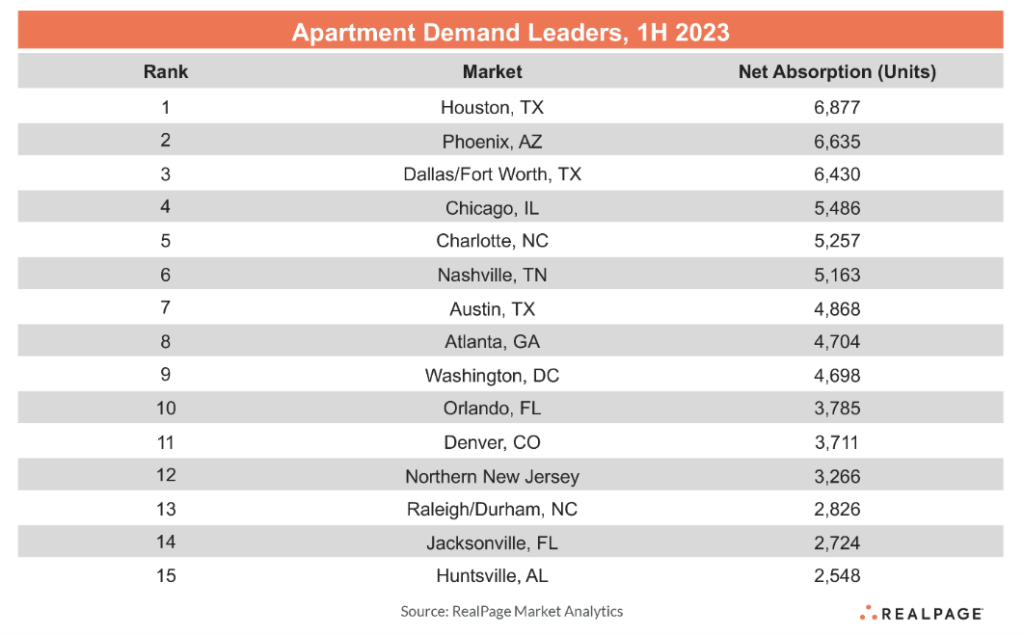
Finally, the markets with the greatest net absorption during the first half of 2023 include Houston, Phoenix, Dallas/Fort Worth, Chicago, and Charlotte.
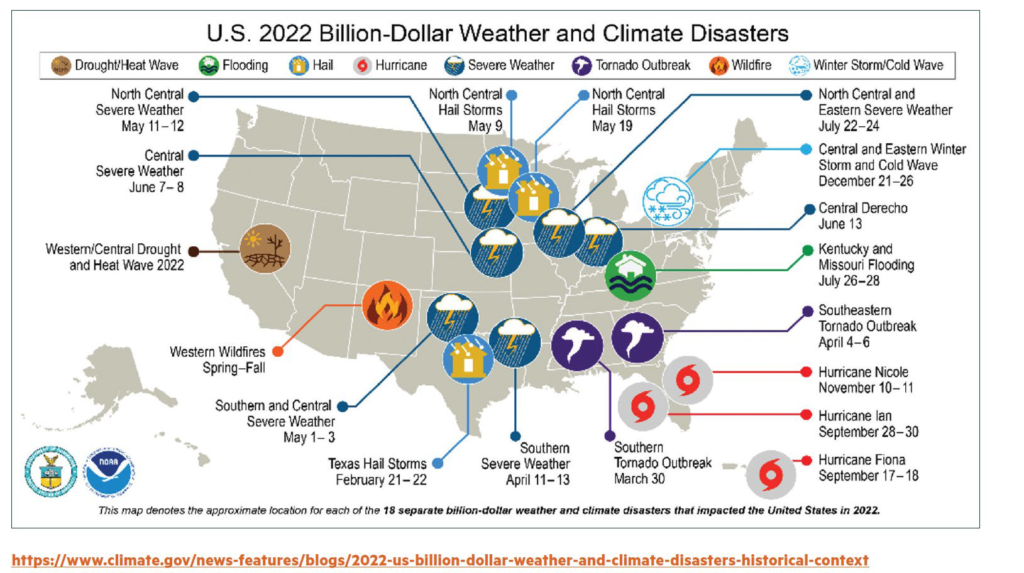
There is one other material issue impacting the residential housing markets, both single- and multifamily units, the escalating cost of property and casualty insurance…if you can even get it. You have probably read stories about how State Farm and Allstate are no longer writing new policies in California and Florida, as they grapple with increased claims from wildfires, hurricanes, and other weather/climate related issues. As you may know, Phoenix just recorded its nineteenth straight day of 110+ degree weather, a record, and July 2023 has thus far been the hottest month in history, at least since we have been measuring such things.
So, I suppose it cannot come as any significant surprise that the third quarter of 2022 marked the 20th consecutive quarter of increased premiums for commercial property/casualty, according to the latest report from the Council of Insurance Agents and Brokers. The average premium increase was up 20.4% in the first quarter of this year, again not a typo. To say insurers exiting certain markets and/or mercilessly increasing premiums are not impacting the residential housing market would be a profound understatement.
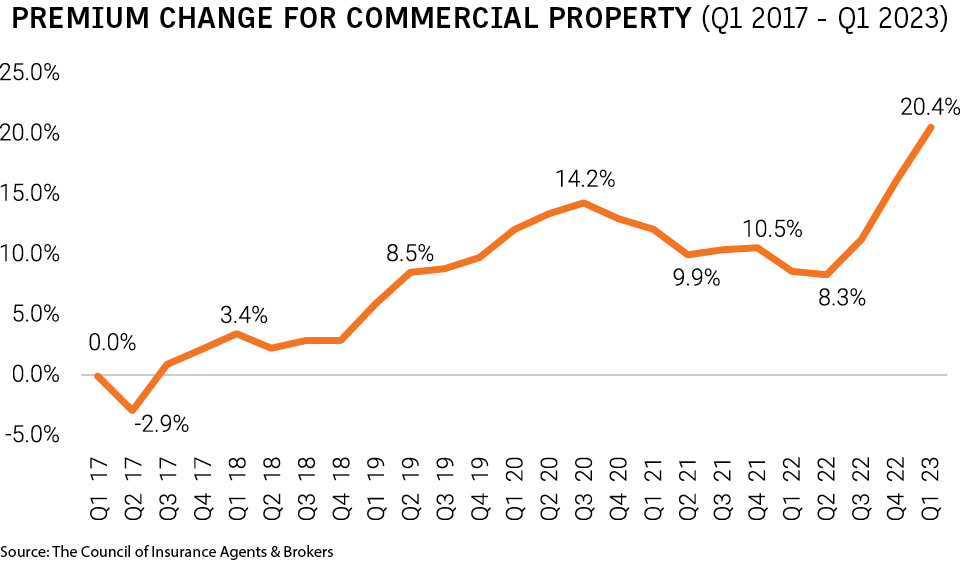
Perhaps a picture tells a thousand words…or a multitude of billion dollar claims.
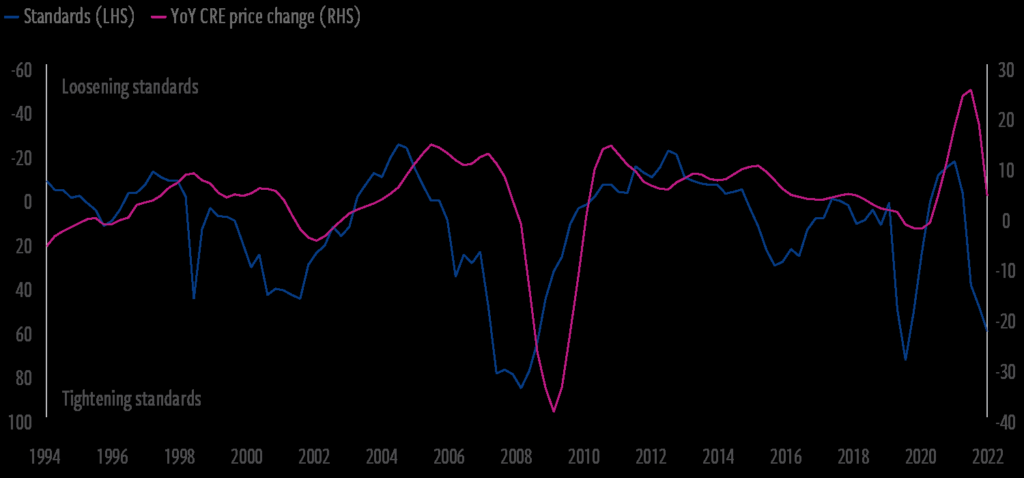
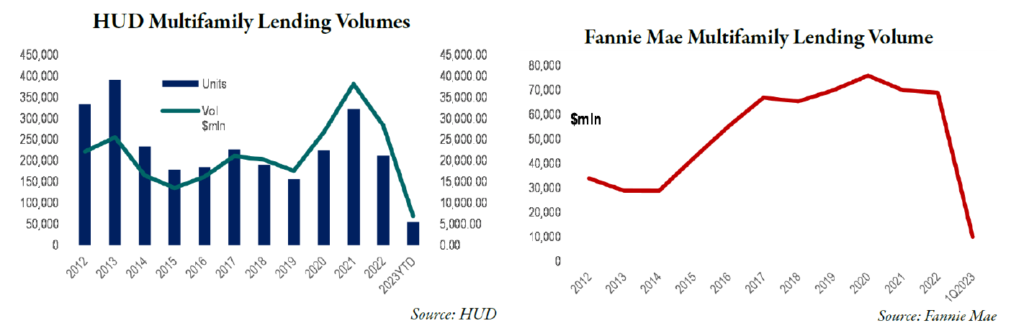
How are mortgage lenders and debt providers behaving in these volatile and uncertain markets?
Even if a broader banking crisis and global credit crunch were averted following the collapse of Silicon Valley Bank, Signature Bank, First Republic, and Credit Suisse, prospective borrowers continue to be squeezed, not just from higher rates, but from stricter underwriting, higher spreads, and ultimately reduced proceeds. It is no surprise that multifamily lending volumes have tanked, reducing available liquidity, just when this source of capital is needed most.
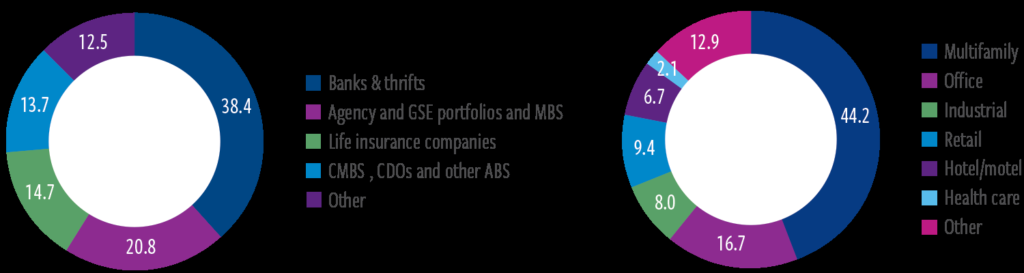
Keep in mind that there is approximately $20 trillion of commercial property in the U.S. (e.g., office, rental housing, industrial warehouses, and retail space) and all have been impacted by macroeconomic and geopolitical events. These assets are encumbered by some $4.5 trillion of collective mortgage debt, broken down as follows:
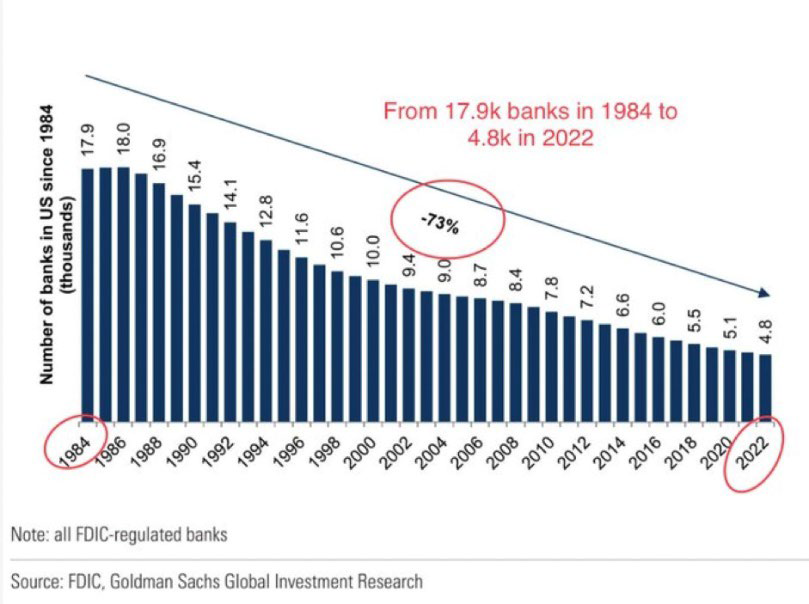
Meantime, the number of FDIC-regulated banks has declined precipitously (over 70%) since 1984.
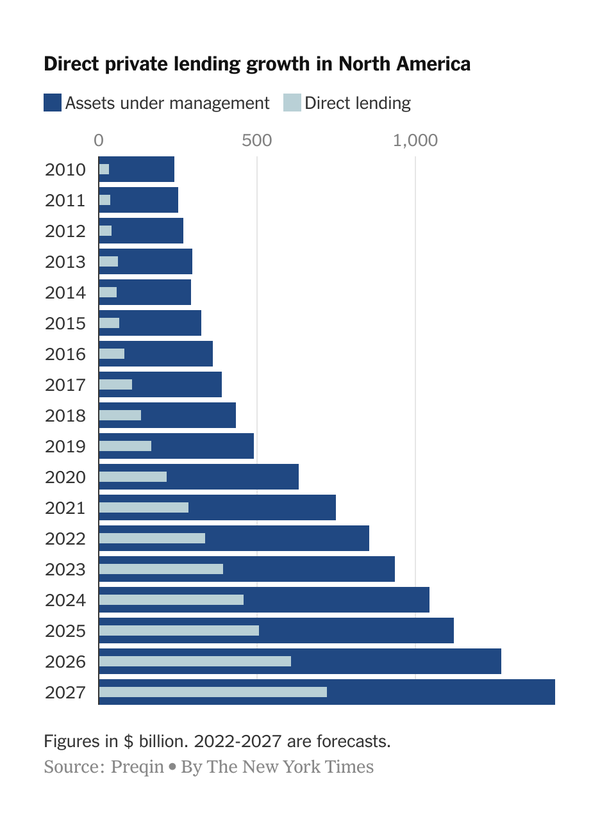
Thus, it is no surprise that the fastest-growing lending segment is “private credit,” or alternative lenders often referred to as “shadow banks.” Since the start of 2008, private credit has grown almost sixfold, to $1.5 trillion, according to the IMF—bigger than the high-yield bond or leveraged-loan markets. At $4.4 trillion, these three markets collectively exceed the value of all commercial and industrial loans provided by traditional banks, at $2.7 trillion. How these shadow banks and debt funds will respond to distress remains to be seen. My sense is that they have different objectives than traditional lenders, but whether that means they will be more or less flexible and willing to “extend and pretend” remains to be seen.
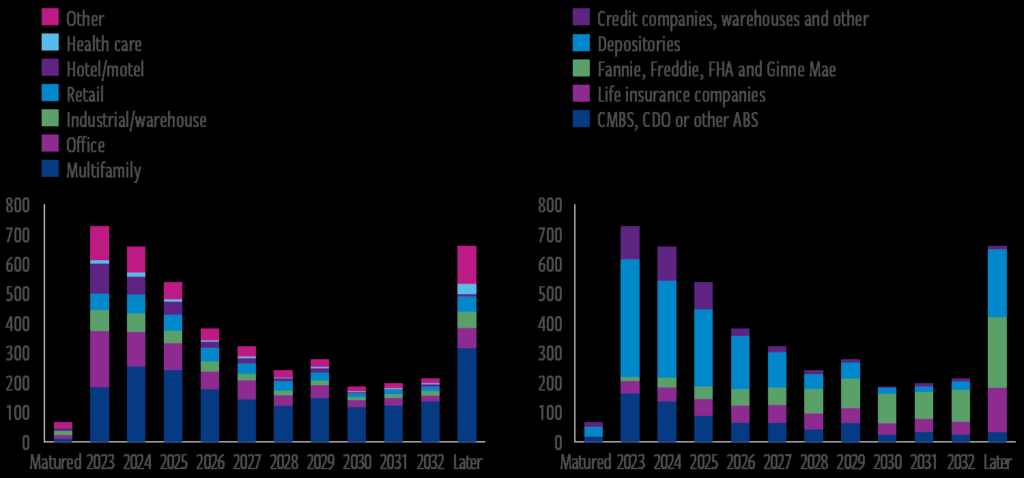
Finally, when are various commercial real estate loans coming due? The vast majority of loans come due between 2023 and 2025.
And consumers? Since they drive so much of the U.S. economy, how are they holding up?
Consumer spending is also sending mixed signals. On the one hand, core personal spending remains positive, though monthly changes in spending have been declining. That is, it seems that the consumer is finally losing steam, at least from the looks of the data.
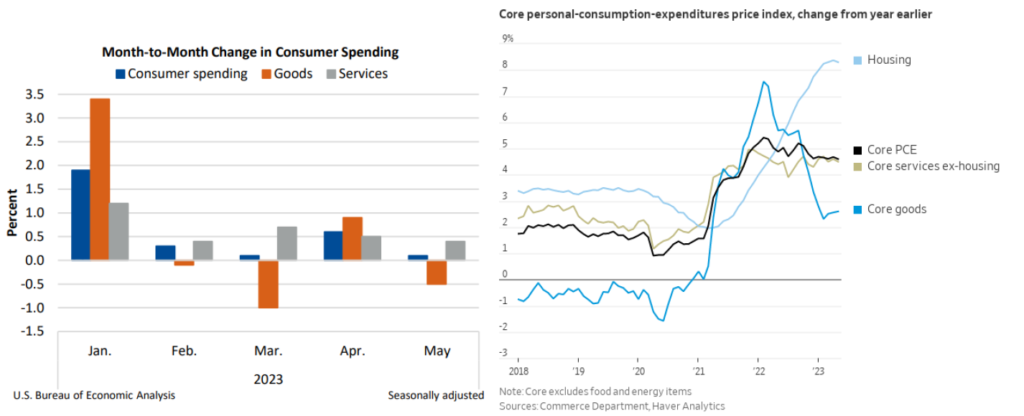
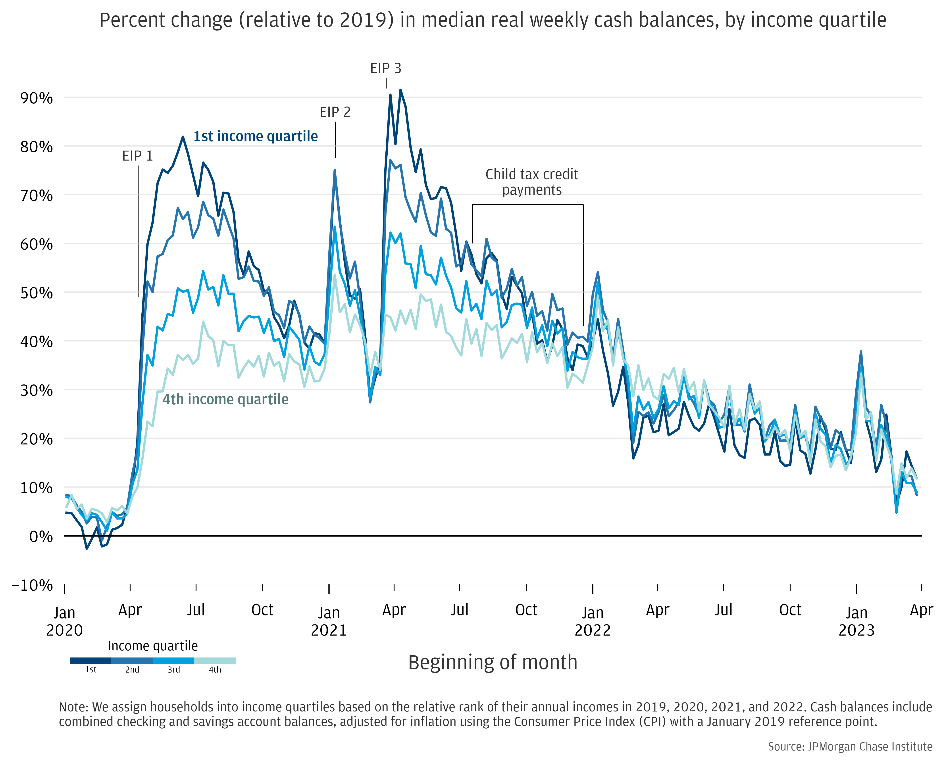
This is confirmed by the most recent data out of Las Vegas, where gaming revenues, one of the most discretionary of all expenditures, declined in both April (3.4%) and May (1.7%), the most recent data available, as compared with the same period last year. Perhaps softening consumer spending is not surprsing, as the cash savings accumulated during Covid, including the impact of government largesse (read: PPP loans) and lower residential mortgage payments (all those homeowners who refinanced in 2020 and 2021), have mostly run their course. Cash reserves are dwindling, with median account balances at their lowest levels in nearly three years, dropping some 41% from their April 2021 peak, according to JP Morgan.
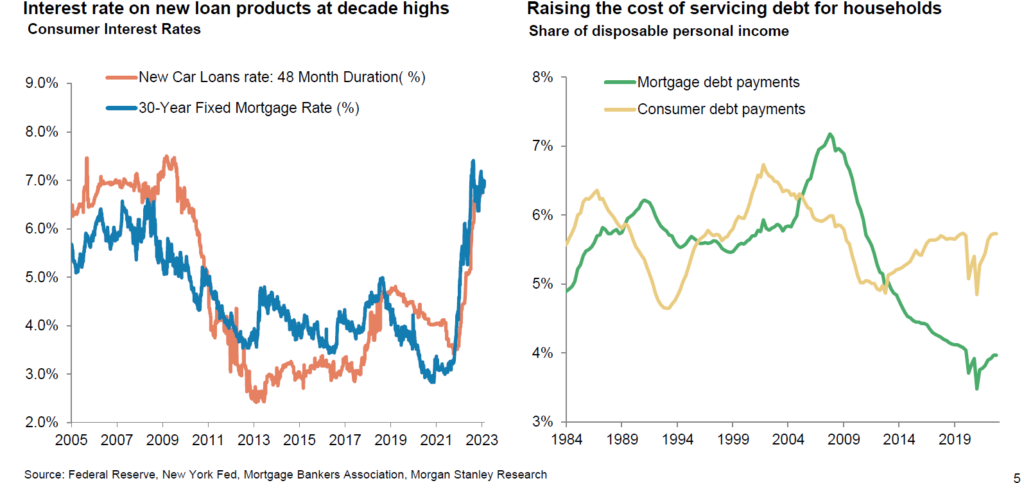
In addition, with higher interest rates on everything from new car loans to credit card debt to mortgages, consumers are feeling an incremental pinch.
On the other hand, having been on more than my fair share of planes in recent weeks, it seems that the consumer is not quite dead yet. Most flights are fairly full and I have to take extra steps to ensure that I don’t end up in that dreaded middle seat (yeah, flying coach is what it is). Data confirms my anecdotal observations, as North American air carrier’s traffic climbed 31% in May 2023 versus May 2022, while the load factor (% of occupied seats) rose 5.1% to 85.1%, the highest in the world. Globally, air traffic is now at 96.1% of May 2019 (B.C., Before Covid) levels, according to the International Air Transportation Association.
What have our wonderful politicians been up to policy wise in Q2, especially with such important local, state, and national elections teed up next year?
•Biden Administration’s New Mortgage Fees: Effective May 1st, new fees made their debut on already lengthy closing statements, as homebuyers with “strong credit” are being charged with higher fees by Fannie Mae and Freddie Mac, to subsidize borrowers with lesser credit. For example, a borrower with a FICO score of 700 and a 20% down payment previously would have paid an upfront fee of 1.25% of the loan amount, say $3,750 on a$300,000 mortgage. Now that fee has been increased to 1.375%. Generally speaking, lesser qualified borrowers will still pay higher fees, but the relative difference is lower. Presumably the objective is to make homeownership more affordable for lower-income borrowers, but I loathe these particular sorts of redistribution efforts, because I have always believed that the obsession with that “American Dream” of homeownership and specifically, that three-bedroom, two-bathroom, three garage home (gotta have room for the boat or Harley), is misguided.
•California Lawsuit Against Elk Grove: In early May, the State filed a lawsuit against the city of Elk Grove, in Sacramento County (near the state capitol), for denying a proposed66-unit affordable housing project. Meanwhile, the State exercised its political influence in getting San Francisco to approve three projects that had been subject to public opposition, including one 450-unit tower. Meanwhile, the State owns 7.6 million acres of property, including something like 58 million square feet of office space, much of which is under-utilized, if used at all. However, the sheer number of California’s 2023 Housing Related
Legislative endeavors are so voluminous that I can’t nearly summarize them all here. However, if you are so inclined, you can follow this link for a complete list and graphical summary, which looks like some of Picasso’s finest work. I just recommend that you fasten your seat belt and grab a glass of your favorite alcoholic beverage before doing so:
https://www.dropbox.com/s/6cnpm11spdoqc2x/CA-housing-bills-20230611.pdf?dl=0
•Montana Legislation Limiting Local Governments from Implementing Rent Restrictions: On the other hand, in May, Montana became the 33rd state to pass legislation limiting local governments from trying to implement rent restrictions, coming on the heels of similar legislation passed in Florida at the end of March and Ohio last June. Of course, other states, from California (of course), Maine, Maryland, Minnesota, New Jersey, and New York are behaving quite differently. According to the National Apartment Association, there are eighty-three state bills out there that would regulate rents. But bills do not legislation make, so we shall see, but I have warned of this inevitability for years. Politicians will do tenant bidding, so long as there are more tenants than landlords who vote.
And finally, what else has been going on in this wacky world that may impact commercial real estate?
•Commercial (office and retail) property woes continue, surprising nobody: Changes in work and shopping habits continue to wreak havoc on related property markets. UBS estimates that around 50,000 retail stores will close in the U.S. in the next five years. Bed, Bath, and Beyond will shutter about five hundred locations in total. The value of malls is down 19% in the past year and 44% since 2016. And the office horror story is well known, with values down 25% or more across the board, with occupied space per worker down 12%from 2015. Regarding specific submarkets, Chicago saw a jump in office sublease availability jump 7.7 million square feet in the first quarter, which pales in comparison to San Francisco’s 8.9 million square feet, a 140.5 percent increase since 2020. The Los Angeles office vacancy rate reached 22.5%, a historic high, while the vacancy rate increased to 17.1percent, up from 16.9% at the end of 2022. The percentage of Washington D.C.’s office market that is available for lease jumped to 21.7%.
•Student Loan forgiveness: In mid-2020, during the throes of the Covid pandemic, the federal government suspended required payments on nearly $1 trillion of student loans. The moratorium was meant to last six months (or roughly the length of a Kardashian marriage),but like so many government policies, it lasted far longer than intended. The moratorium was extended eight times, of course, which is comical. Don’t get me wrong. I fully understand the argument that the government has a history of forgiving debt (e.g., PPP loans) and bailing out corporations, the old “what’s good for the goose is good for the gander” argument, though I don’t necessarily subscribe to it.
In any event, student loan payments recommence in September, at long last, which will curbsome consumer spending, at least on the margin. In addition, the Supreme Court recentlyruled that President Biden did not have the unilateral authority to forgive some $400 billionin student loans without congressional approval. In response, the Administration announcedthat it will forgive $39 billion of such loans under a different, income-driven proposal, whichwill more likely pass muster and judicial review. We shall see. The important takeaway isthat many consumers will be required to service debts with funds they were previously ableto spend on other goods and/or services…including rent (presumably).
•Deficits and Debt Ceiling Negotiations: I am not sure if you have ever seen the billboard-sized display on Sixth Avenue between 42nd and 43rd Streets in midtown Manhattan, which provides a running total of our nation’s gross outstanding debt and each American family’s share of it. I am also not sure it quite compares with Lady Liberty, the Empire State Building, or Grand Central Station in terms of tourist attractions, but you certainly can’t miss it if you happen to stumble upon it. Anyhow, when this unusual “clock” made its debut in 1989, our debt approximated $3 trillion. Here is a more recent picture, sobering as it might be. You will note that the clock still begins with a “3,” but there are more digits after that:

I mention this in the context of both the recently completed debt ceiling negotiations, which can charitably be labeled a “_hitshow,” as the agreement to raise the ceiling by $4 trillion merely allows us to borrow enough to pay existing obligations and fund government operations for the next two years. So, let’s dispel some misconceptions right off of the bat. One, the negotiations and accompanying agreed-to spending cuts do virtually nothing to balance the budget. Sure, it will cut spending by some $1.5 trillion over the next decade, but the agreement doesn’t lay a hand on areas of real spending: Social Security, Medicare, and defense, three outflows that collectively represent nearly 80% of our annual federal budget. And there’s the rub.
While I appreciate the political sensitivity to making cuts (or significant changes) to these programs, I don’t see any way that we can’t, at least without substantially raising taxes. We spend six times more per senior than per child, trading off social security benefits and education, but let’s be clear. That tradeoff simply isn’t sustainable as the costs of entitlements increase, our population ages (I have written a lot about that in prior letters, our so-called “baby bust”), we have fewer younger workers, and the government collects far less taxes. Tax collections have predictably fallen, following the passage of the 2017 Tax Cuts Job Act (TCJA). At some point, our politicians on both sides of the aisle are going to have to face the music, sacrificing politics for national fiscal security.
Figures from the Congressional Budget Office, which coincidentally don’t anticipate recessions, crises, or understated required infrastructure investments (think conversion of auto industry to electric), tell just a part of the story. In any event, I find the graph below to be just a tad frightening, perhaps even more than most driver’s license and high school yearbook photos.
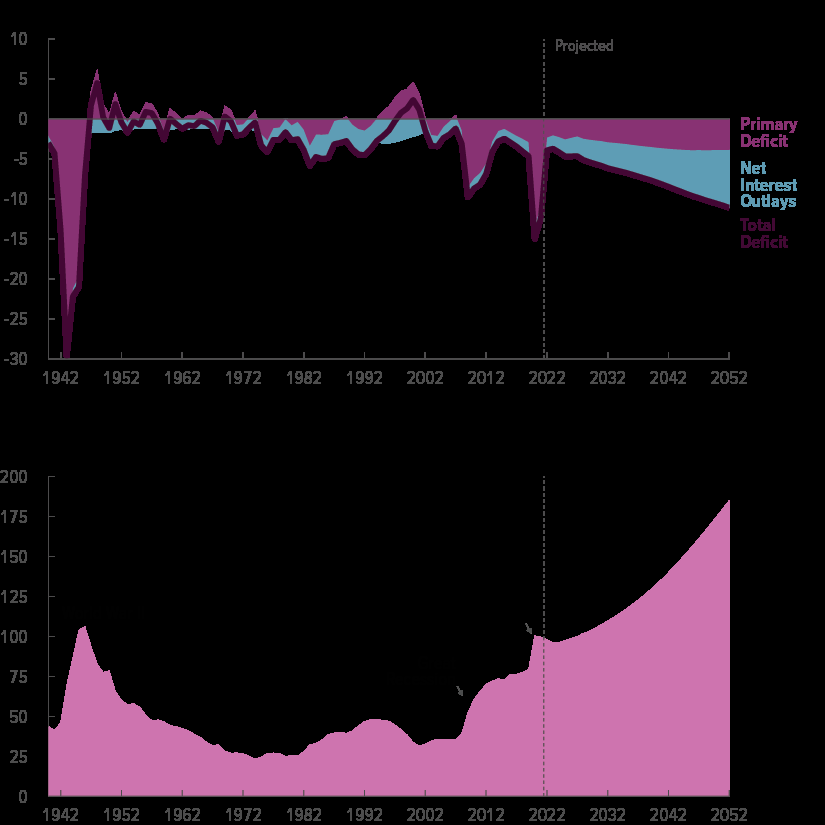
Something has to give, as the gap between revenues and outlays widens over time, mainly because of rising interest costs and growth in Medicare and Social Security spending, resulting in ever-widening budget deficits. After World Wars I and II, we repaid debt by raising taxes and cutting expenditures. Compare that to today’s mindset, which seems completely different, and both parties to blame, of course. Even before Covid, in an economy characterized by record high stock prices, strong housing and commercial real estate markets, and low unemployment and inflation, we still ran a deficit, in part due to the TCJA. In any event, if the federal government does ultimately decide to face the music, raise taxes, and reduce spending, the impact should be materially deflationary, all else equal.
•Artificial Intelligence (AI) and real estate: Unless you have been living under that proverbial rock (and if you have, I sure hope it isn’t in Phoenix), 2023 might be labeled “The Year When AI Became Mainstream,” with the release (or at least popularization) of ChatGPT. At this point, it is hard to say how AI will impact commercial real estate, but you can bet your bottom dollar (or your favorite cryptocurrency) that it will be impactful in the following areas:
-Location, location, location: AI companies and related jobs and infrastructure investment will cluster around established tech markets, universities, and innovation centers.
-Increased demand for certain types of assets: AI research and development will require more and perhaps distinct types of data centers, energy grids and related infrastructure.
-New asset and product types: The AI transition will spur the development of new types of commercial properties, or at a minimum, significant investment in existing product types (e.g., office, industrial) just to make them AI-compliant. Think about the last time you saw an individual staffing a parking kiosk. Smart cameras and related security systems will replace uniformed officers. Or consider how hotel lobbies will change as the need for in-person interactions (e.g., check-in, check-out, concierge services) changes.
-New/Changed underwriting processes: AI-will substantially automate underwriting and the understanding and analysis of markets and individual properties. Individual acquisition personnel will still be needed, if just to exercise judgment and interpret data, but I suspect investors and sponsors will require less human engagement in the underwriting process.
-Design and space function: AI will allow engineers, architects, and other related professionals to more efficiently and quickly design and customize spaces and settings.
In my career, I cannot recall a market with so much conflicting data, adding to investor uncertainty and making predictions no easy task. However, while challenges lay ahead, crises and down cycles inevitably provide opportunities.
If one were to watch the news (or media outlets that hold themselves out as such), pay attention to certain polling, or read your weather app, you might think the sky is falling, the planet melting, and a recession around the corner. In fact, according to a recent Wall Street Journal poll, a large majority (78%) of individuals polled “do not feel confident” that their children will be better off than they were, the highest percentage since the survey began in 1990.
With all the negativity emanating from everyone from politicians to media outlets to my mother-in-law, such pessimism is understanding. Interest rates remain high and volatile, and while recent inflation data looks promising, it is too early to declare victory. Consumers will be more stretched and challenged in coming months, as cash reserves dwindle, student loan repayments resume, and the cost of consumer debt remains high. The disruptive potential of AI and negative psychological influence of social media only add to the understandable angst. And commercial real estate investors, capital providers, and all other industry participants are going to be busy working through a longer trough of this particular downcycle. There is no escaping this reality.
However, from GDP figures to employment levels to real wages to corporate profits and equity markets, it appears that a recession is not in the cards, at least for the time being. However, that could change quickly if the Fed continues to wield the interest rate sledgehammer, causing additional disruption to investors, lenders, and capital markets, generally. But let’s be clear. Our economy has done and is doing pretty darn well, all things considered, especially relative to the rest of the world, despite news and rhetoric to the contrary.
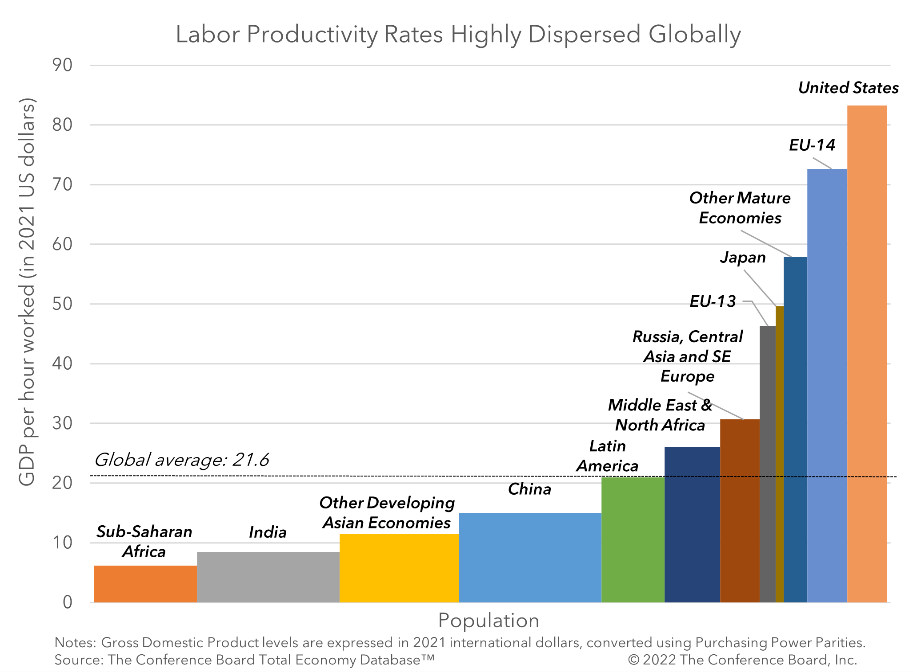
In 1990, the U.S. accounted for a quarter of total global output, essentially the same percentage today, even in the rising power and influence of China and India. We represent nearly 60% of the collective GDP of the G7, the most of all other developed nations. Our economic productivity is much higher than that of Europe or Japan. American companies own more than 20% of patents registered abroad, more than China and Germany combined.
Regardless, and as I stated in unequivocal terms last quarter, we are more than cognizant of the challenges that lie ahead and are acting accordingly in all aspects of the business. As I mentioned earlier, our portfolio is mostly tracking to budget and plan, at least on operations. Debt service, including reserves for interest rate caps, on our floating-rate debt is a different story, and we continue to pursue options to convert this debt to fixed rate via cash-in refinancings. Ironically, while higher interest rates cause debt service pain, we benefit from higher rates inasmuch as the cost of renting becomes far more favorable vis a vis buying.
Meanwhile, we do not intend on ignoring potentially attractive acquisition opportunities when they present themselves, though they are certainly not easy to find (bid-ask spreads between potential buyers and sellers remain wide), and transaction volume has declined substantially, consistent with the loan data I provided earlier. According to CoStar, multifamily sales volume fell 74% in the first quarter of the year, the largest year-over-year drop since the first quarter of 2009, at or near the trough during the Great Financial Crisis. We were pleased to acquire the attractive three asset, Inland Empire based portfolio here in Southern California in an off-market transaction and are still soliciting investor capital for that particular transaction, so I hope you might take a look at that opportunity.
Finally, thank you for supporting the firm and its endeavors, even in these challenging times. Rest assured we take our role as a fiduciary seriously and will continue to do our best navigating these tricky times and markets, providing our views, perspectives, and relevant market and property-specific information in a timely and transparent fashion, which I hope is part our corporate DNA. Please feel free to reach out to me or a member of our investor relations team (Aimee DeFord and Tania Mirchandani) should you have any questions, concerns, or other needs regarding either your existing investments or opportunities we are pursuing.
Best,

Eric Sussman
Managing Partner