“If the road is easy, you’re likely going the wrong way.”
–Terry Goodkind
“In a crisis, don’t hide behind anything or anybody. They’re going to find you anyway.”
–Bear Bryant
In recent years, universities across the country have been wrestling with student requests for what are known as “trigger warnings,” explicit alerts that the material they may read, see, or hear as part of a course curriculum might upset them or cause excessive or unwarranted stress. Thus far, after nearly 30 years at UCLA, I have yet to provide any such warnings in my accounting and real estate courses and I do not anticipate doing so in the future. For better or worse, prospective students will just have to prepare themselves in other ways for the discomfort they will inevitably feel when I subject them to discussions about housing policy, a dreaded cold call, and/or a less than fashionable shirt from Jos. A. Bank or Kirkland (as though one exists).
However, as I delve into the second quarter real estate and financial markets and some views about what might lay ahead, please be warned that my opinions, observations, and perspectives may induce nausea, abdominal pain, and/or constipation, essentially the same potential side effects one might experience from taking Ozempic or watching the Mets this season. Here is the upshot. During the first quarter of 2023, longer-term interest rates declined from the end of 2022, providing optimism that the Fed’s unprecedented and aggressive efforts to combat inflation had been successful and that they would return to more accommodative policies in 2024, if not earlier. Such would be beyond welcome to commercial real estate participants.
Unfortunately, this optimism was dashed during the second quarter, as inflation – especially the cost of food, housing, energy, and Taylor Swift tickets – remained stubbornly persistent, and interest rates reversed course, which in large part led to the mid-quarter failure of First Republic Bank (May 1st), the second largest in U.S. history ($229 billion in nominal assets) and a growing number of foreclosures, principally in the office market. In turn, the MOVE index, which measures interest rate volatility, has spiked.
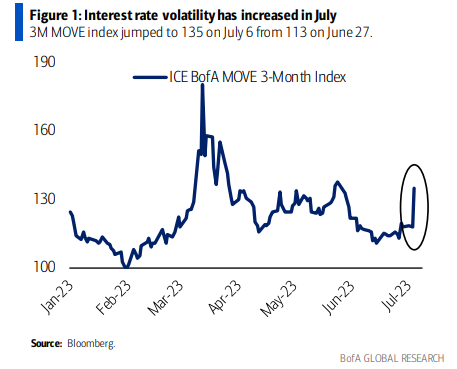
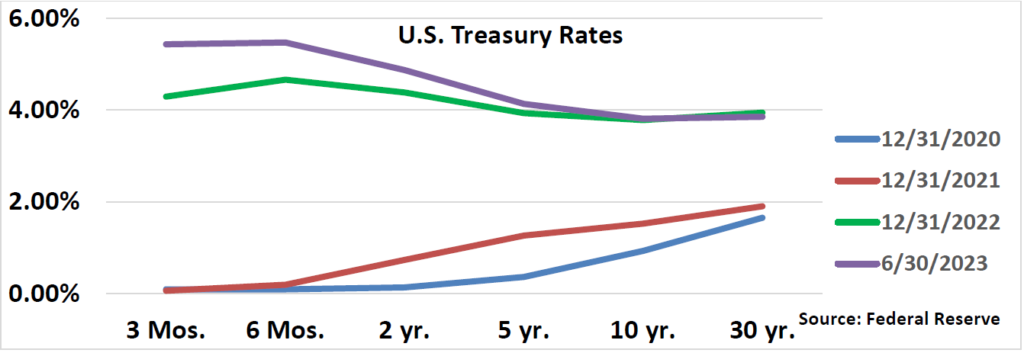
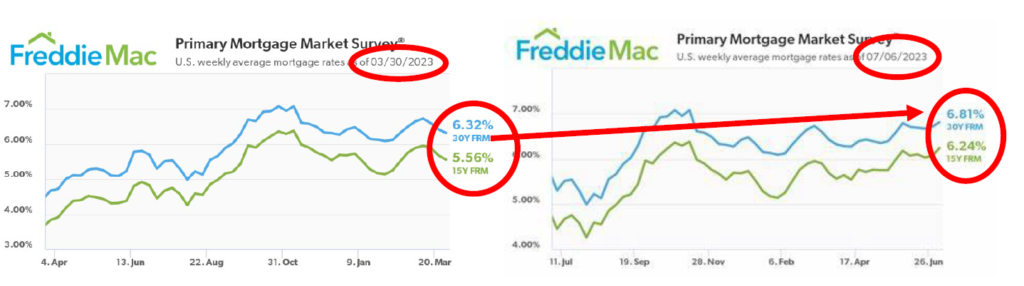
In fact, between June 30th and July 7th, the yield on 10-year U.S. Treasury bonds increased from 3.81% to 4.06%, only to reverse course and decline to 3.83% one week later, on July 14th. Rates on 30-year mortgages increased from 6.32% at the end of the first quarter to 6.81% at the end of the second, and by the end of last week neared 7.0% (6.96%). Two-year Treasury yields ended the second quarter at 4.88%, up from 4.06% at the end of March. And at last glance? 5.04%. Such sharp increases in rates not only reduce the values of bonds and commercial real estate, at least on paper and perhaps temporarily, but add to investor and lender uncertainty.
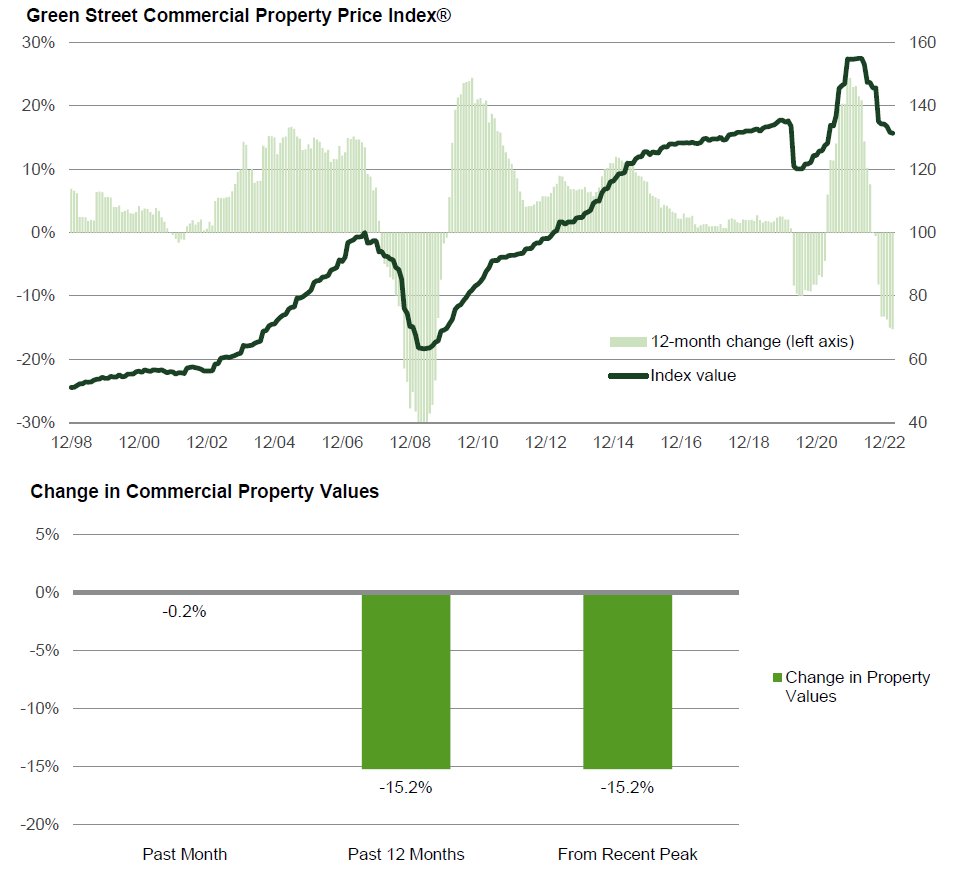
This reversal and increased volatility in interest rates foretell challenges for the commercial real estate industry and its participants, from lenders to principals and sponsors to other service providers (e.g., mortgage bankers/brokers, escrow/title officers, property/asset managers). In short, the next couple of years will likely be a slog, as owners and sponsors work through the stresses caused by higher costs of capital, tightening liquidity, and increased uncertainty. Of course, we have already witnessed significant dislocation in the office and retail sectors, with a large number of foreclosures and failures experienced from coast to coast…and sometimes in-between. According to a new report from MCSI Real Assets, some $64 billion of commercial real estate is now distressed, while more than $150 billion is “potentially troubled.”
Moreover, previously “hot” segments of the commercial real estate space – multifamily (including student and senior housing), industrial, and data centers – while having far better underlying fundamentals, are not immune and increased delinquencies, notices of default, and foreclosures in these sectors are inevitable. In many cases, the problem is not and will not be the real estate itself – rents, occupancy rates, and/or pre-debt cash flow – but merely untenable capital structures and excessive leverage in a higher rate environment. In fact, while the Clear Capital portfolio continues to mostly track forecasts and operating cash flow projections, it is the debt, especially that which is floating rate (even hedged), which is proving challenging, especially for legacy assets. On paper, nearly all commercial real estate values are probably down anywhere from 15 to 30%, merely from increases in interest rates. While perhaps temporary, these unrealized losses are not without consequence.
In fact, earlier this year, Veritas, San Francisco’s largest landlord, defaulted on a huge loan (at least $448 million) encumbering nearly 2,500 apartment units in ninety-five different buildings throughout the city. The largest mortgage loan (non-performing) being shopped secures a 75-building portfolio consisting of 2,149 rent-controlled units and forty-five commercial spaces, mostly ground-floor retail. The locations are generally good, and we are talking about San Francisco, though the city has been plagued by homelessness, a softening technology market, and a flight of retail and white-collar office workers, as has been widely publicized.
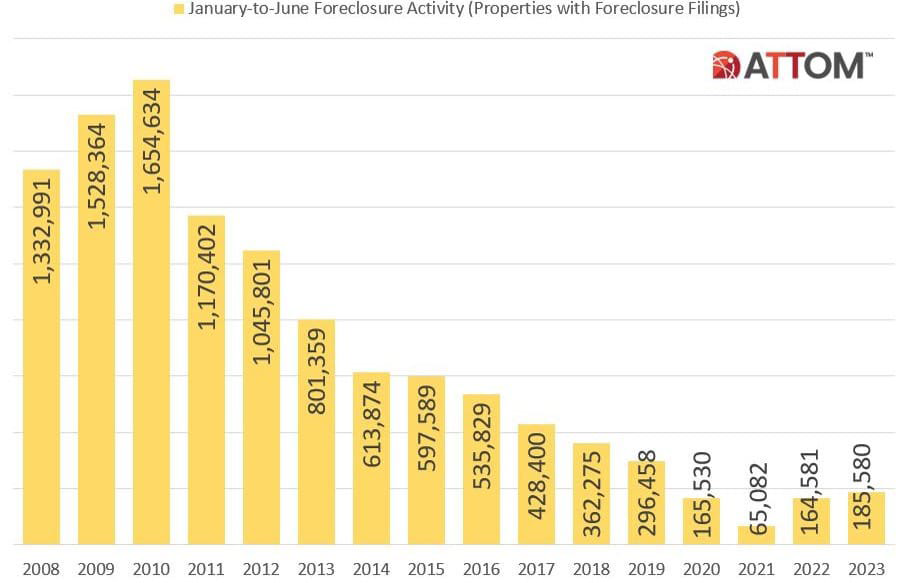
While foreclosure activity during the first half of 2023 pales in comparison to that experienced in the Great Financial Crisis, foreclosure activity has picked up in recent months and I sense we are still in the early stages of this cycle, which will likely have a long(er) trough. These realities should present potentially attractive investment opportunities and we are excited about our recent acquisition of the “IE3,” a portfolio of three assets in the Inland Empire. However, with less liquidity, higher cost of capital, and more conservative underwriting, closing on even appealing opportunities won’t be a slam dunk. Fear and uncertainty are unwelcome bedfellows to acquisition endeavors.
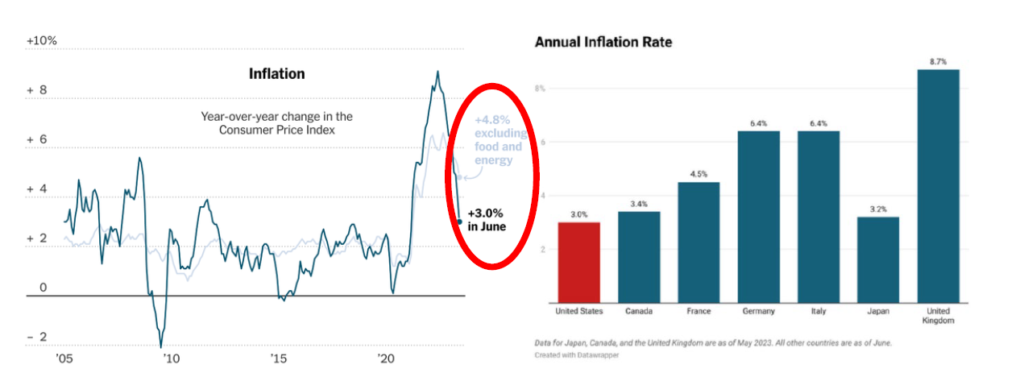
And inflation data itself? Both consumer and producer prices have moderated, with inflation declining for eleven straight months. The Consumer Price Index was up 3.0% in June (4.8%, excluding food and energy costs), year-over-year, versus a whopping 9.1% a year ago. The U.S. now has the lowest inflation rate among developed nations, despite the political rhetoric.
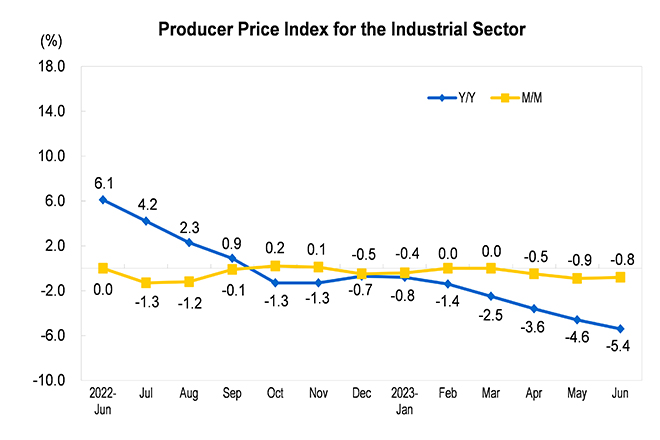
And producer prices? The June Producer Price Index was down 0.8% between May and June, and 5.4% from June 2022 to June 2023. Producer prices have declined even faster than consumer inflation, so inflationary pressures are definitely easing. However, the Fed’s two percent inflation target still seems aways away.
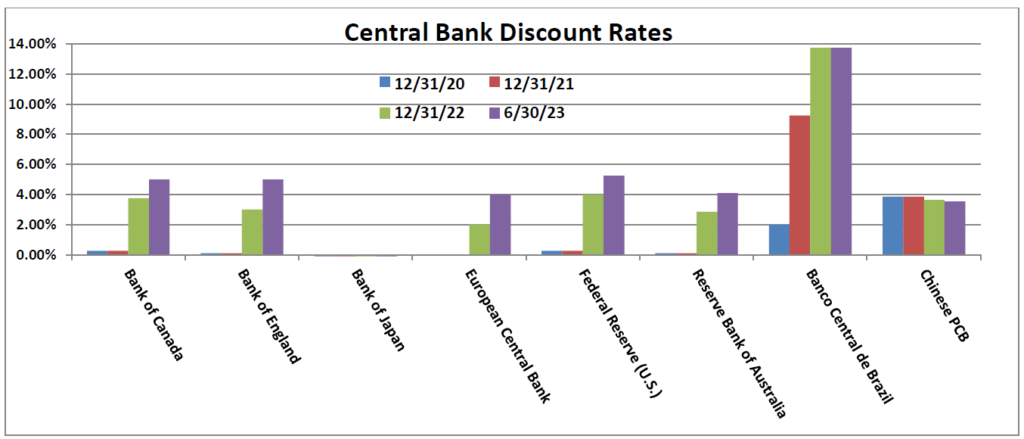
Regardless of moderating inflation, June witnessed the world’s major central banks delivering the largest number of monthly interest rate hikes year-to-date, surprising investors and signaling the possibility (if not probability) of more tightening ahead as policy makers grapple with inflationary pressures. Seven of the nine largest central banks hiked rates last month, while two opted for no change (including the U.S.). Both Norway and the Bank of England increased rates by a larger-than-expected fifty basis points, while Canada and Australia also resumed their rate hiking ways. Sweden, Switzerland, and the European Central Bank also tightened, taking the collective tally of rate hikes to 225 basis points last month. May witnessed six rate hikes. Across the entire G10 (group of eleven industrialized nations), there have been twenty-eight rate hikes this year, totaling 950 basis points, and since Norway started raising rates in September of 2021, major central banks have increased rates by a combined…3,765 basis points. Yowza.
The increase in rates and the specter of persistently higher inflation are probably the biggest news stories of the quarter, narrowly beating out the discovery of a small bag of cocaine in the White House (wasn’t mine, I swear), the departure of Pat Sajak as host of Wheel of Fortune, the tragic Titanic submarine implosion, a failed coup (or whatever the heck that was) in Russia, and the predictable (if not unnecessarily politicized) conclusion of debt ceiling negotiations closer to home.
Regardless, conflicting data appears around every corner, making economic, financial, and market predictions about as difficult as interpreting Mona Lisa’s beguiling smile or anticipating the winner of an Elon Musk-Mark Zuckerberg cage match. Analyst estimates of global GDP are wide, twice the range of predictions made in previous years, and the word “uncertainty” appears more than sixty times in the most recent International Monetary Fund’s Global Economic Outlook. One day the Dallas Fed Chief, Lorie Logan, says that interest rates should rise further, and then, on the very next day, Fed Chief Jerome Powell says something far less hawkish. These conflicting narratives remind me of that memorable scene from 1982’s Fast Times at Ridgemont High, when Sean Penn (or rather, his character, Jeff Spicoli) responds to a friend after totaling this friend’s brother’s new Camaro and the friend’s subsequent admonition…’My brother is going to _hit! He’s going to kill us!’ to which Spicoli replies, ‘Make up your mind, dude! Is he going to _hit or is he going to kill us?’
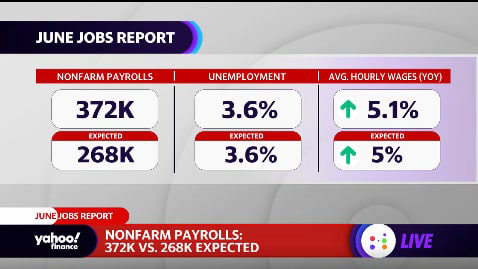
Let’s start with the job market, since the Fed is tracking this data closely in setting interest rate policy. In short, it remains surprisingly robust, rekindling fears of persistent inflation and higher interest rates. In June 372,000 new jobs (non-farm) were added versus the 268,000 expected. Wages increased 5.1%, year-over-year. Despite the odds, the U.S. labor market continues to add jobs and even companies in the crosshairs of rising interest rates are holding onto or adding workers. Builders, architects and engineers, real-estate agents, vehicle manufacturers and other businesses typically sensitive to higher borrowing costs have actually increased employment levels this year, though I sense this may reverse in the coming months.
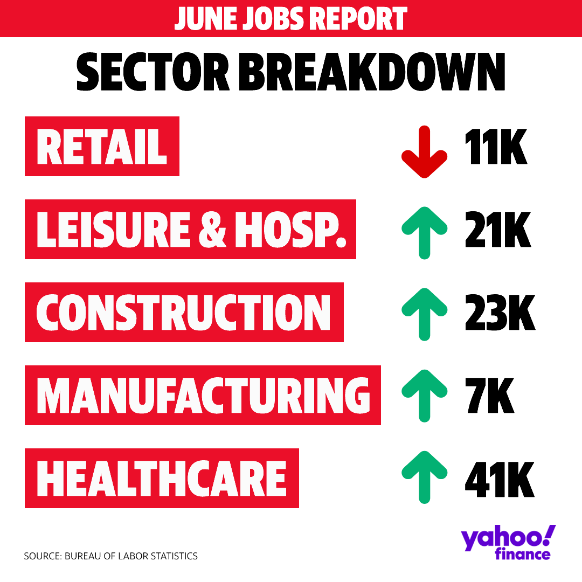
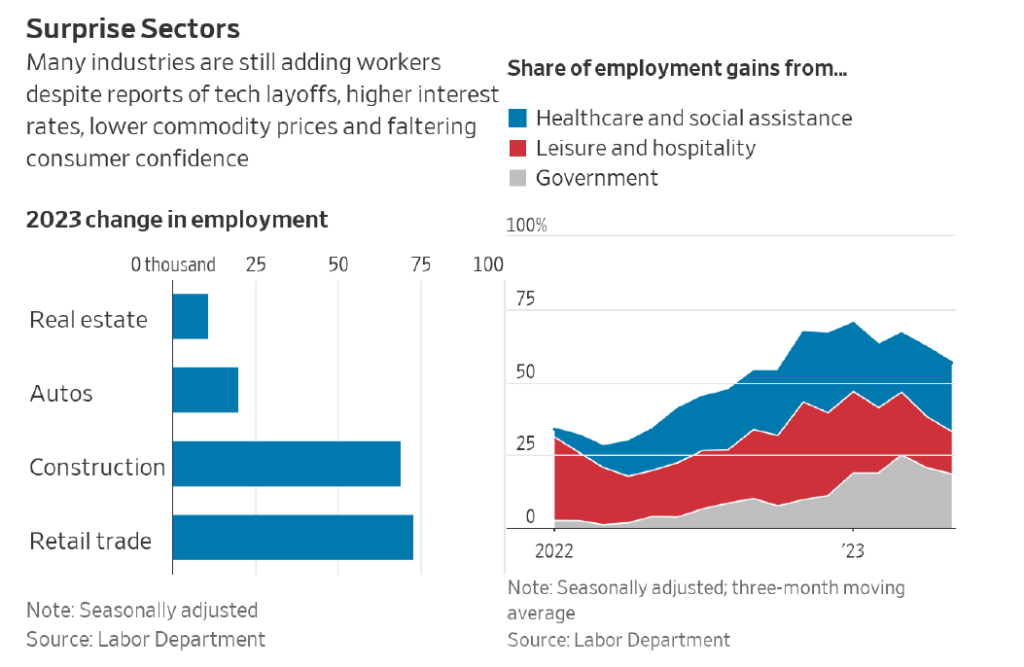
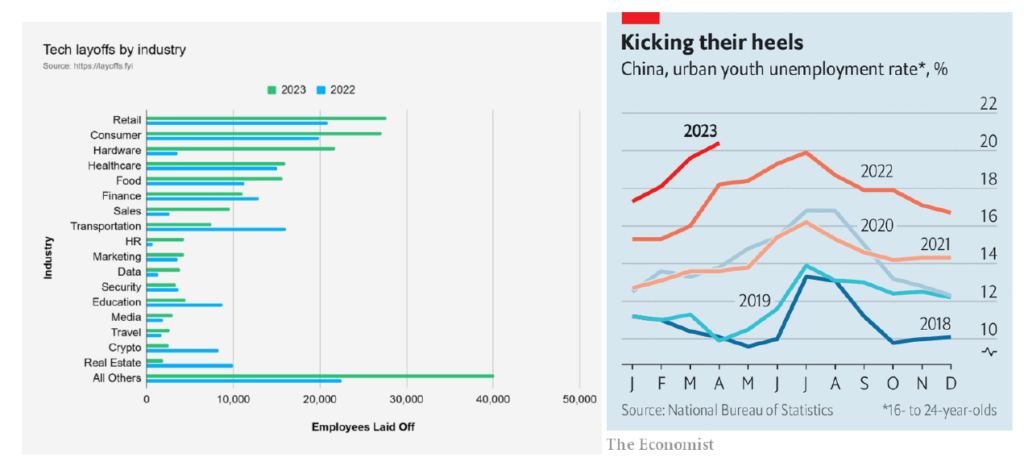
These job gains, along with much larger increases in industries still trying to claw back workers lost during the pandemic, have added up to almost 1.6 million new jobs in the first five months of 2023, outpacing forecasts. Meanwhile, other firms continue to reduce headcounts. Although merely an anecdotal (and unsubstantiated) data point, I heard a rumor that a surprisingly large number of MBAs from UCLA Anderson did not have job offers at graduation time last month as traditional recruiters in tech (largest hirers in recent years), finance, consulting, and real estate have pared back hiring needs. Other firms have pushed back start dates. On a somewhat related note, I recently read that the jobless rate among Chinese 16- to 24-year-olds rose to a whopping 21.3%, compared to 7.5% here in the U.S. Yowza, again.
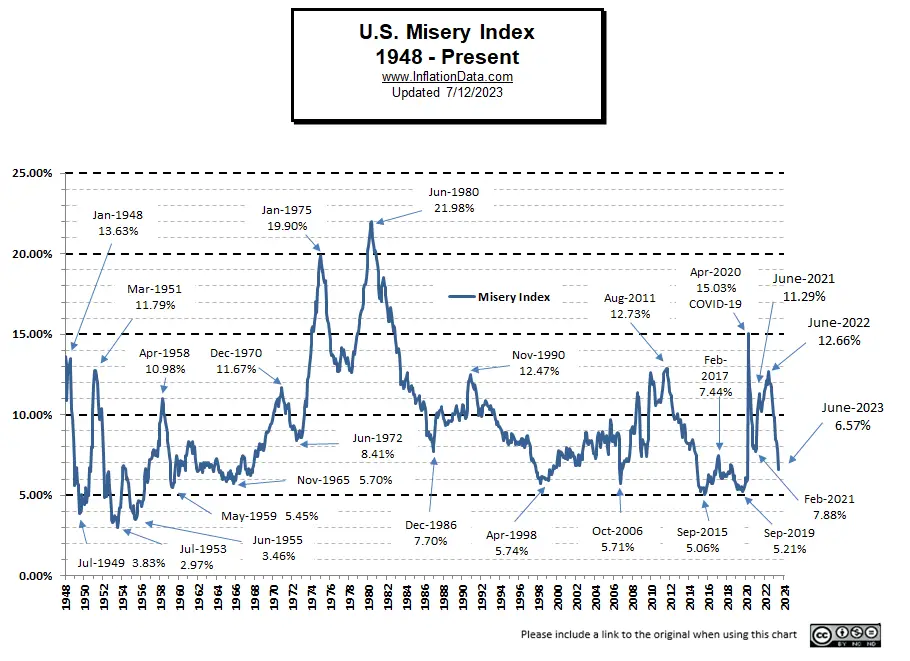
Meantime, the so-called, but appropriately monikered “Misery Index,” computed by adding the previous 12-month change in the Consumer Price Index percent change and the unemployment rate, has been trending downward, to a recent 6.57% in June. The last time the Misery Index was this low was before Covid, in September 2019. So, would someone please tell me why I don’t feel better…or at least less miserable?
How about the equity markets? Well, the S&P 500 is up 17.4% this year, with the tech-heavy NASDAQ gaining a whopping 34.9% thus far, its best first half in 40 years. If you compare the equity markets between 2009-2010 and 2022-2023, they look eerily similar, with a significant downturn followed by a reversal the following year.
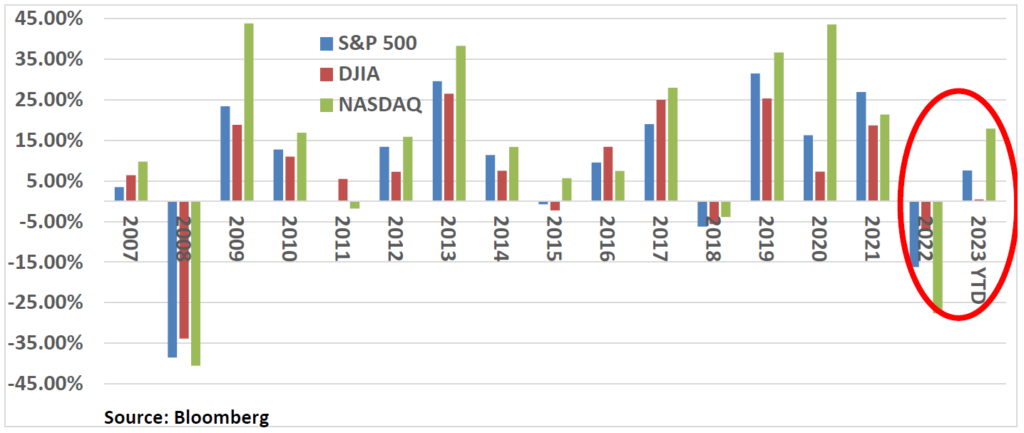
However, when we peek under the equity market hood, there is more (or less) than meets the eye. In fact, when I recently read a headline that the S&P 500 and NASDAQ had reached their highest levels since last August and that the price rise was almost enough to represent a “bull market” (generally defined as a 20% rise in the S&P 500), I did a double take. Bull market? Really? This has to be the least fun and exciting bull market I have ever experienced.
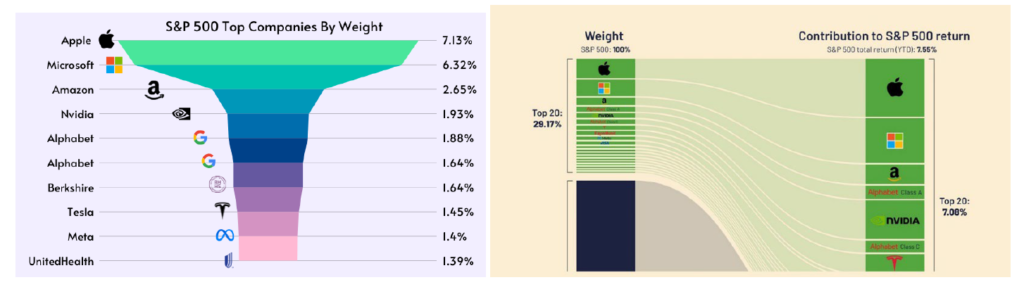
And no wonder. This “bull market” has really been powered by a small number of mega-cap tech stocks: Apple, up 38% this year. Nvidia, up 165%. Tesla, 128.5%. Meta (Facebook), 151.5%. In fact, just twenty stocks, including the likes of Apple, Microsoft, Amazon, Nvidia, Alphabet (Google), Meta, Berkshire Hathaway, Tesla, and United Health, represent over 90% of S&P 500 returns through May, despite comprising less than 30% of the Index. In fact, on Friday of last week, Nvidia’s stock price moved up and down so substantially in a single day that the implied value of the intraday swing (change in market value) was larger than the market capitalization of four hundred other companies in the S&P 500. That’s just nuts. Another “yowza” seems warranted.
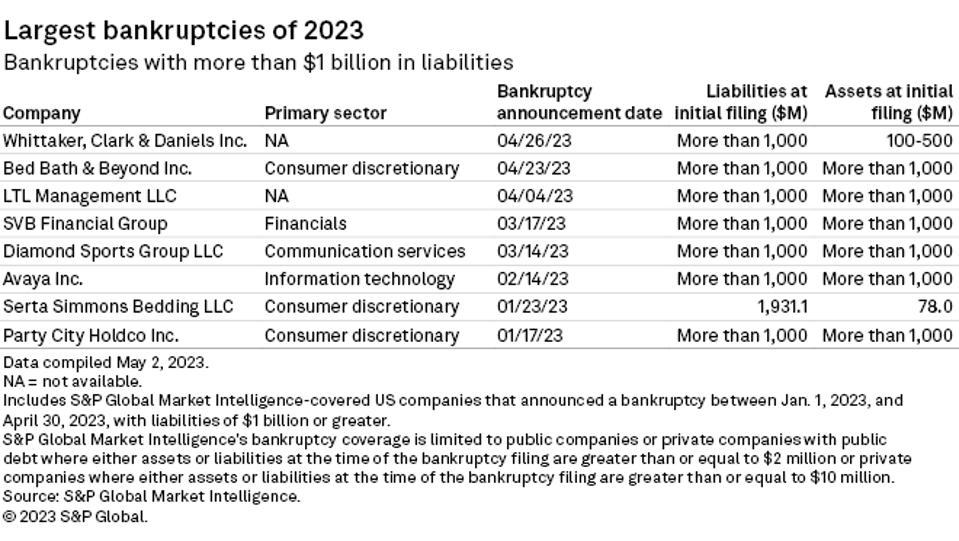
Meantime, corporate defaults rose last month, with forty-one in the U.S. so far this year, more than double the same period last year, according to Moody’s. Heavy debt loads, high interest rates, and uncertain economic conditions are beginning to take their toll. The number of bankruptcy filings in the U.S. this year has also sharply risen to levels not seen since 2010. Through June, there were 324 bankruptcy filings, not far behind 2022’s total of 374, according to S&P. The list of failures includes Silicon Valley Bank and Bed Bath & Beyond, of course, but others like regional sports network owner, Diamond Sports, and the information technology firm, Avaya.
And how about the residential real estate markets, both single- and multifamily? How are they holding up in these challenging markets?
In a word, “resiliently,” with single-family prices up 2.0% nationally for the year ended April, representing 135 straight months of higher prices. That is not a typo. While individual markets may be struggling (e.g., Bay Area, Denver, Phoenix, Los Angeles), the overall market remains in decent shape and prices firm. Perplexed, the New York Times recently posed a rhetorical question in an article captioned, ‘What is Happening in the Housing Market?’ trying to explain how housing prices have not dropped despite the extraordinary increase in interest rates.
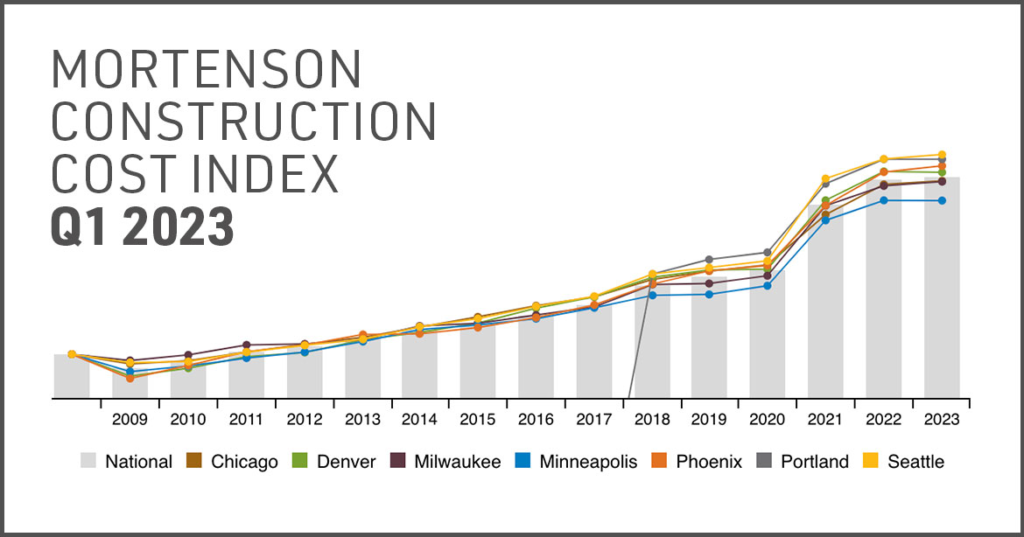
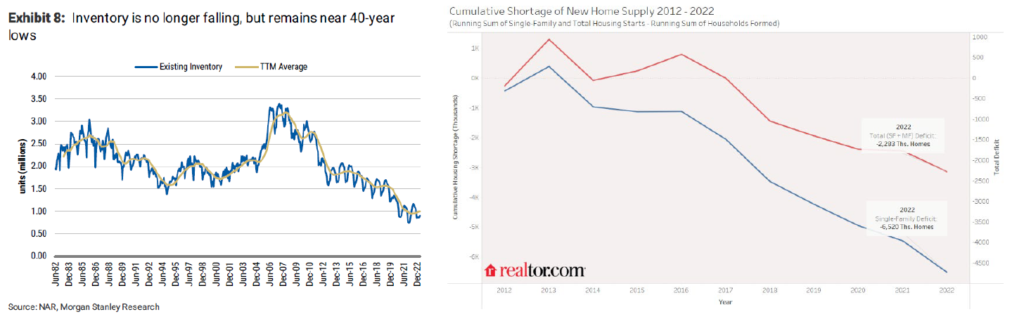
The answers are fairly simple. Record-low supply tops the list, as inventory hovers near 40-year lows. Baby boomers, with their trillions of equity in homes, ain’t selling. Folks who own or bought homes in recent years, with mortgage rates of 3.0% or less, ain’t selling. And builders can only build so many homes, with constraints on everything from buildable lots, available labor, raw materials, along with (of course) higher construction and borrowing costs, at least for smaller, privately-owned builders who cannot easily access the capital markets.
While more than 23,000 Alternative Dwelling Unit (ADU) or “Granny Flat” permits were issued in California last year (versus 5,000 in 2017), following the elimination of R-1 zoning in the state, the overall impact represents that proverbial drop in the bucket. The fact is that newly built homes represent about a third of all homes for sale in March, about double historical norms.
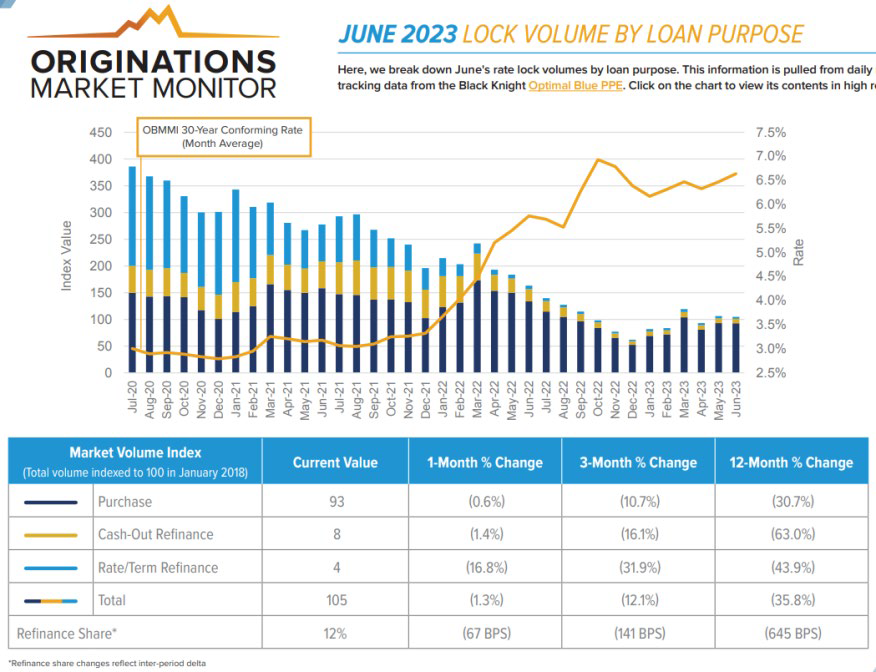
Some buyers, perhaps recognizing that waiting for a significant price drop in home prices is indeed akin to “waiting for Godot,” have decided not to wait any longer. Institutional and foreign buyers are also reliable sources of demand, albeit at reduced levels from previous years. In fact, while prices are firm, sales volumes are down sharply, as are mortgage applications.
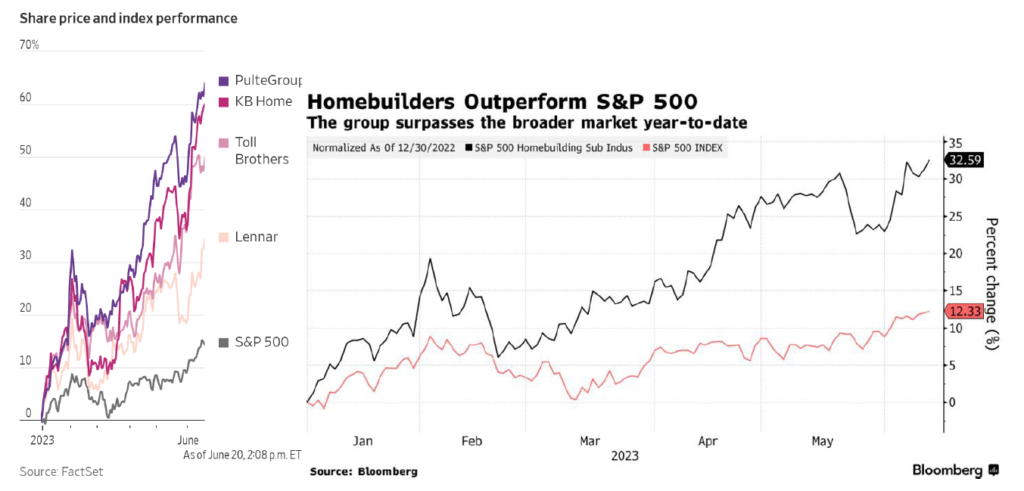
Meanwhile, homebuilders have been one of the hottest sectors in the equity markets thus far in 2023, defying all expectations and all the economic headwinds and higher rates. For example, KB Home is up over 24% this year and over 79% in the past 12 months, something I would never have predicted. Another “yowza” seems more than apropos. The entire homebuilding sector is up nearly 33% in 2023, more than double the return of the S&P 500. Yeah, those homebuilder stocks sure are boring. #sarcasm
Ironically, the apartment market has not fared quite as well in recent months, as rent growth has stalled. The average of six national rental-price measures from rental-listing and property data companies indicates that asking rents for new leases rose just under 2% over the 12 months ending in May. One of the rent measures, courtesy of Redfin, indicates that rents for both apartments and single-family rental homes, actually declined 0.6% in May, year-over-year. A decline in asking rent over a 12-month period had only happened one other time since the Great Financial Crisis, when the rental market briefly declined in 2020 because of Covid-19, ending a decade-long streak of rent growth. However, while data providers agree on the direction of multifamily rents, they do not necessarily agree on the precise figures themselves.
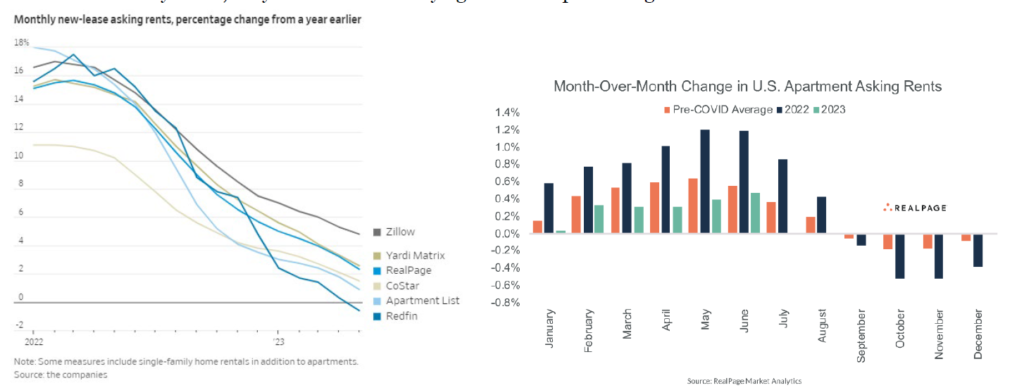
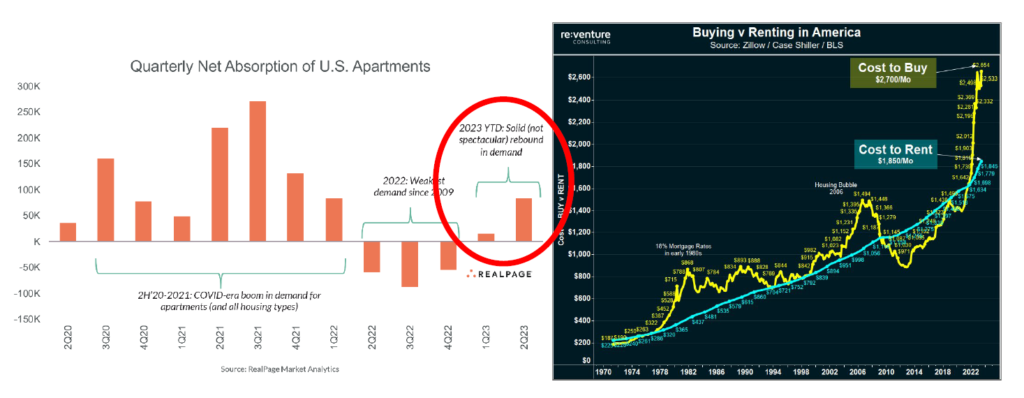
There are a couple of silver linings. One, absorption for multifamily units (excess of unit leasing activity above new supply) and demand are picking up. Two, affordability challenges continue to benefit apartments over single-family residences, making the renting decision more compelling. According to Realtor.com, the median home price in the U.S. was $445,000 in June, versus $441,000 in May. Combined with mortgage rates of around 7%, the monthly “cost to buy” is at least 40% higher than to rent.
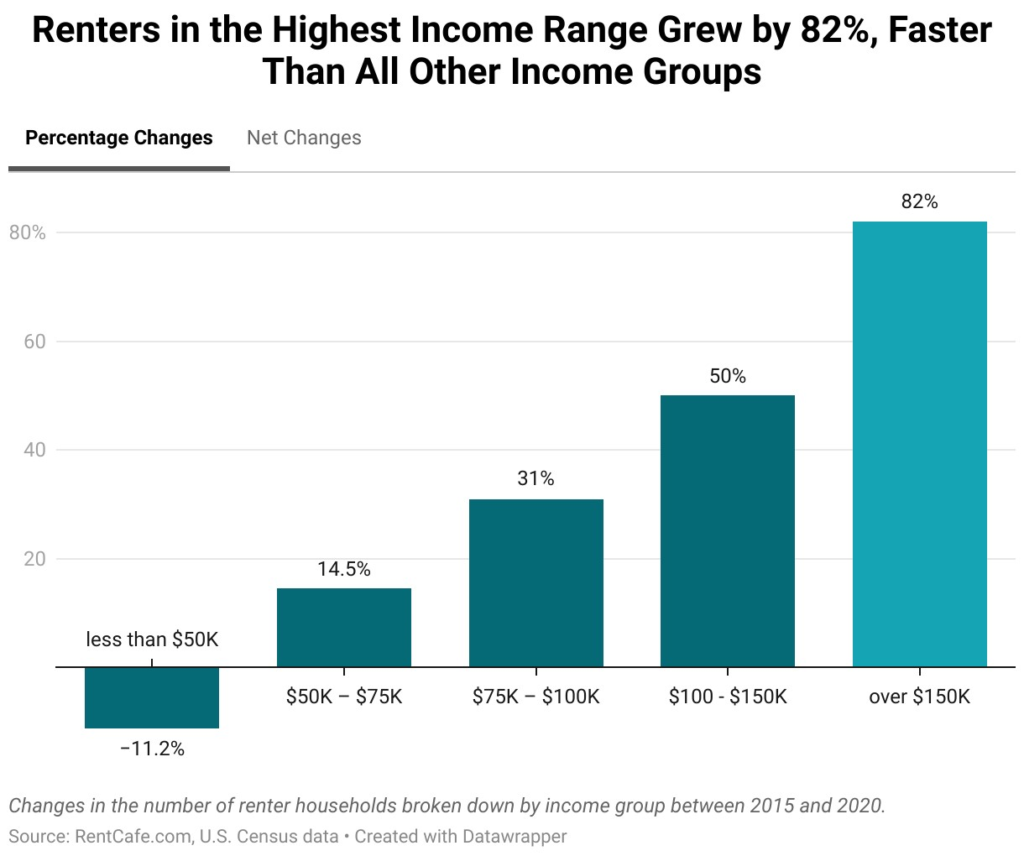
According to a number of articles I have recently read, higher income individuals and families are choosing to rent, perhaps also preferring the extensive amenities and flexibility provided by high-end multifamily units. Renters in the highest income range (household income over $150K per year) grew by over 80% between 2015 and 2020 (most recent data available), according to RentCafe.
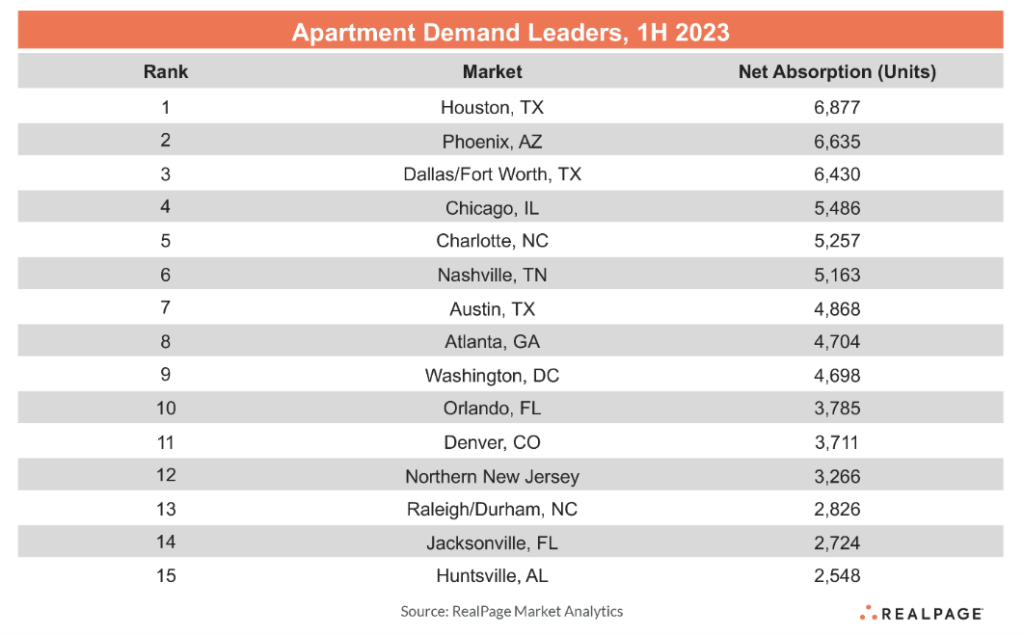
Finally, the markets with the greatest net absorption during the first half of 2023 include Houston, Phoenix, Dallas/Fort Worth, Chicago, and Charlotte.
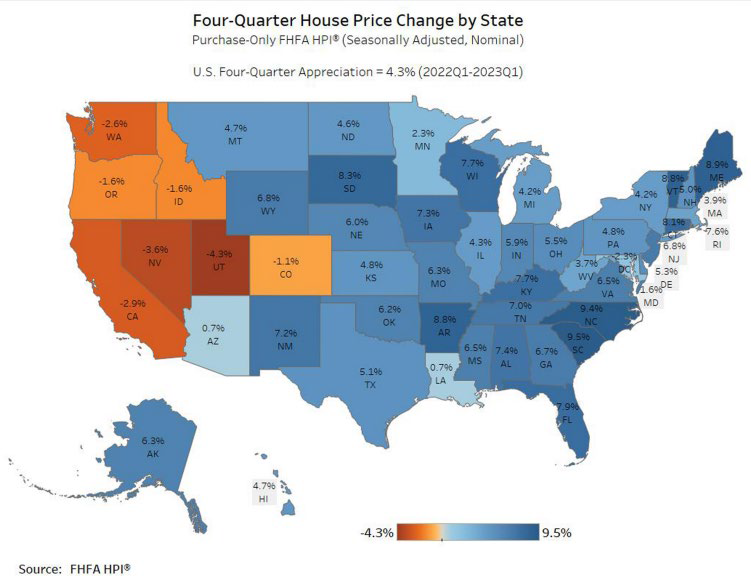
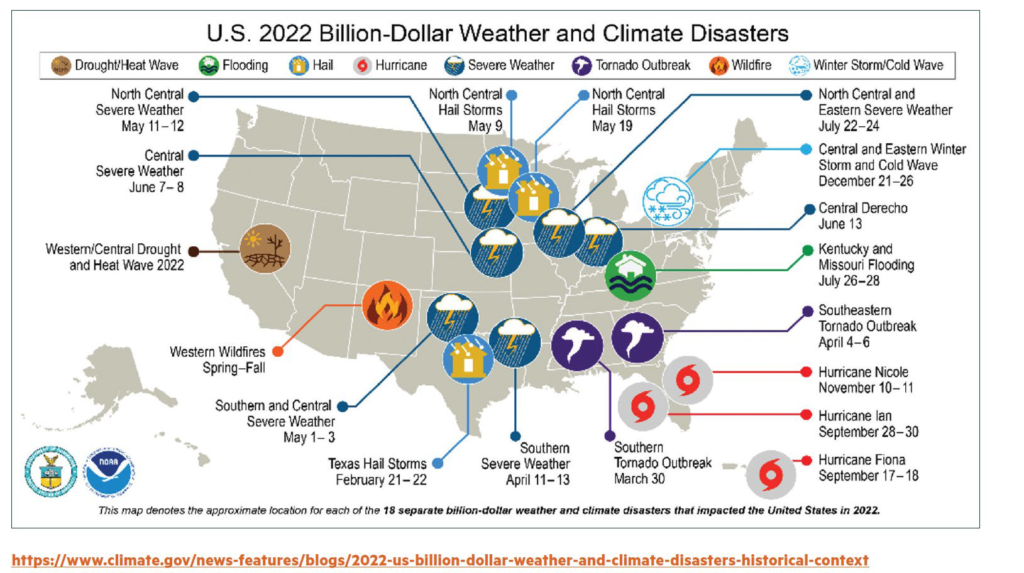
There is one other material issue impacting the residential housing markets, both single- and multifamily units, the escalating cost of property and casualty insurance…if you can even get it. You have probably read stories about how State Farm and Allstate are no longer writing new policies in California and Florida, as they grapple with increased claims from wildfires, hurricanes, and other weather/climate related issues. As you may know, Phoenix just recorded its nineteenth straight day of 110+ degree weather, a record, and July 2023 has thus far been the hottest month in history, at least since we have been measuring such things.
So, I suppose it cannot come as any significant surprise that the third quarter of 2022 marked the 20th consecutive quarter of increased premiums for commercial property/casualty, according to the latest report from the Council of Insurance Agents and Brokers. The average premium increase was up 20.4% in the first quarter of this year, again not a typo. To say insurers exiting certain markets and/or mercilessly increasing premiums are not impacting the residential housing market would be a profound understatement.
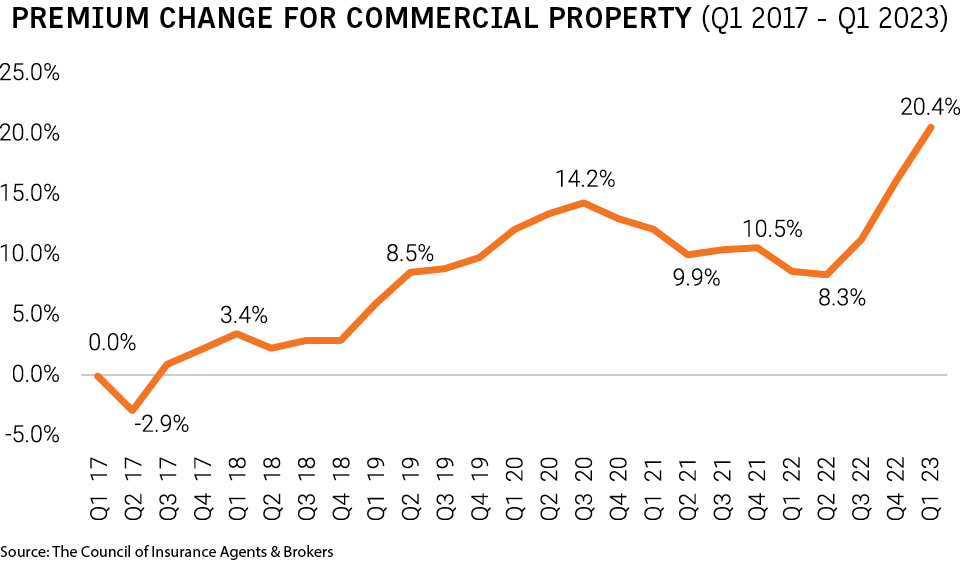
Perhaps a picture tells a thousand words…or a multitude of billion dollar claims.
How are mortgage lenders and debt providers behaving in these volatile and uncertain markets?
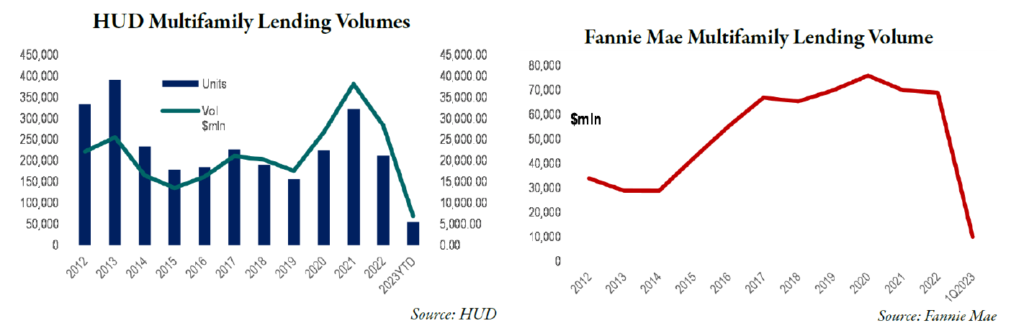
Even if a broader banking crisis and global credit crunch were averted following the collapse of Silicon Valley Bank, Signature Bank, First Republic, and Credit Suisse, prospective borrowers continue to be squeezed, not just from higher rates, but from stricter underwriting, higher spreads, and ultimately reduced proceeds. It is no surprise that multifamily lending volumes have tanked, reducing available liquidity, just when this source of capital is needed most.
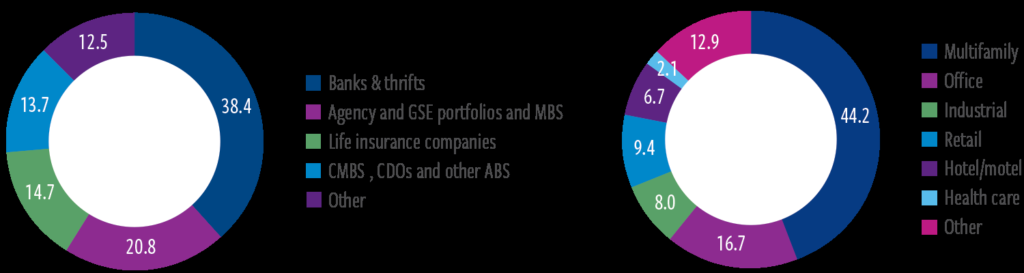
Keep in mind that there is approximately $20 trillion of commercial property in the U.S. (e.g., office, rental housing, industrial warehouses, and retail space) and all have been impacted by macroeconomic and geopolitical events. These assets are encumbered by some $4.5 trillion of collective mortgage debt, broken down as follows:
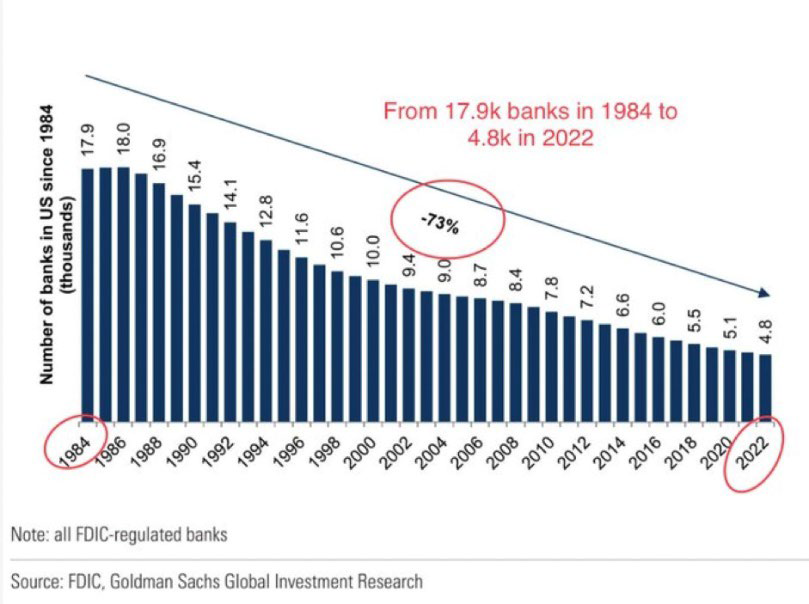
Meantime, the number of FDIC-regulated banks has declined precipitously (over 70%) since 1984.
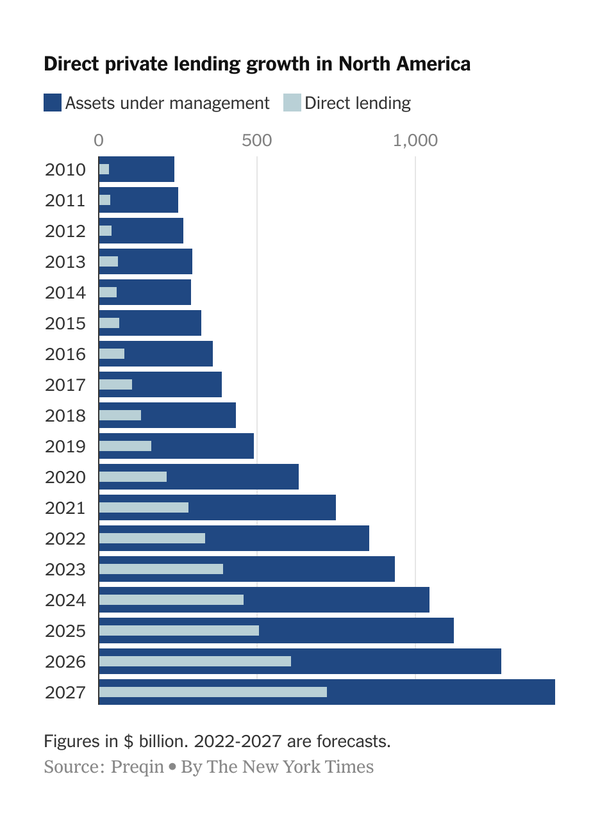
Thus, it is no surprise that the fastest-growing lending segment is “private credit,” or alternative lenders often referred to as “shadow banks.” Since the start of 2008, private credit has grown almost sixfold, to $1.5 trillion, according to the IMF—bigger than the high-yield bond or leveraged-loan markets. At $4.4 trillion, these three markets collectively exceed the value of all commercial and industrial loans provided by traditional banks, at $2.7 trillion. How these shadow banks and debt funds will respond to distress remains to be seen. My sense is that they have different objectives than traditional lenders, but whether that means they will be more or less flexible and willing to “extend and pretend” remains to be seen.
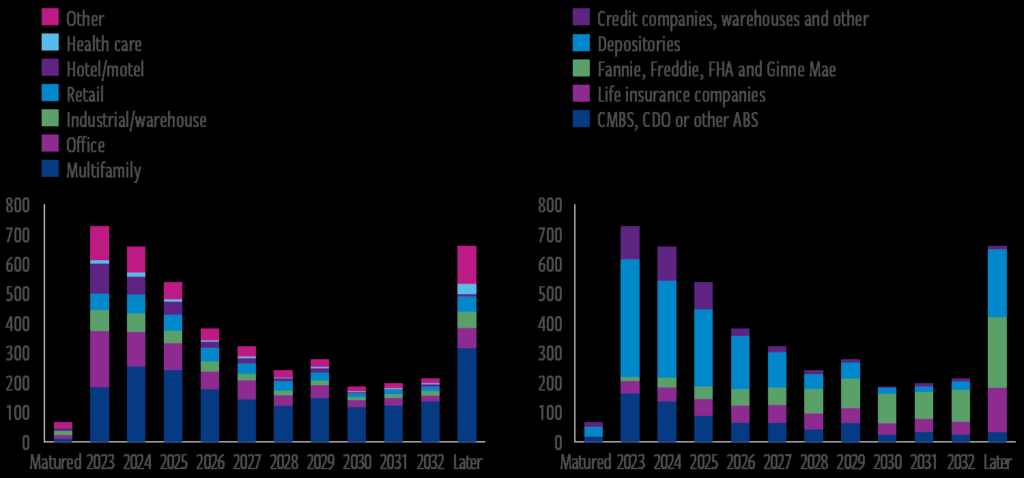
Finally, when are various commercial real estate loans coming due? The vast majority of loans come due between 2023 and 2025.
And consumers? Since they drive so much of the U.S. economy, how are they holding up?
Consumer spending is also sending mixed signals. On the one hand, core personal spending remains positive, though monthly changes in spending have been declining. That is, it seems that the consumer is finally losing steam, at least from the looks of the data.
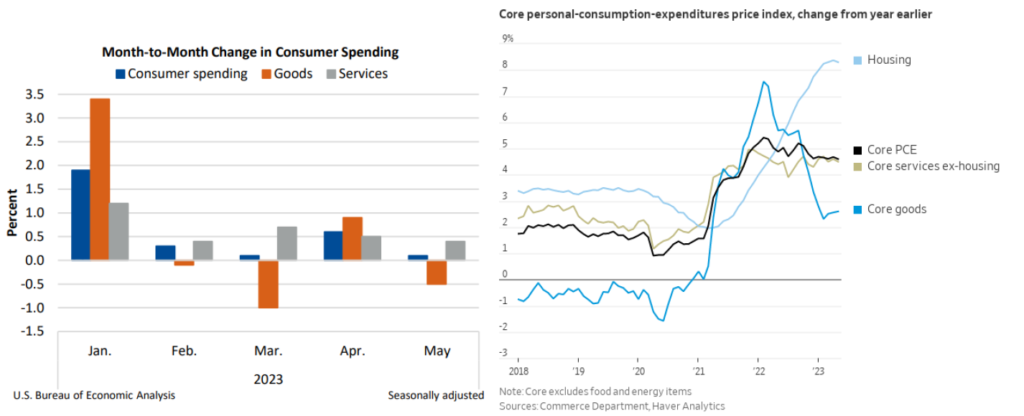
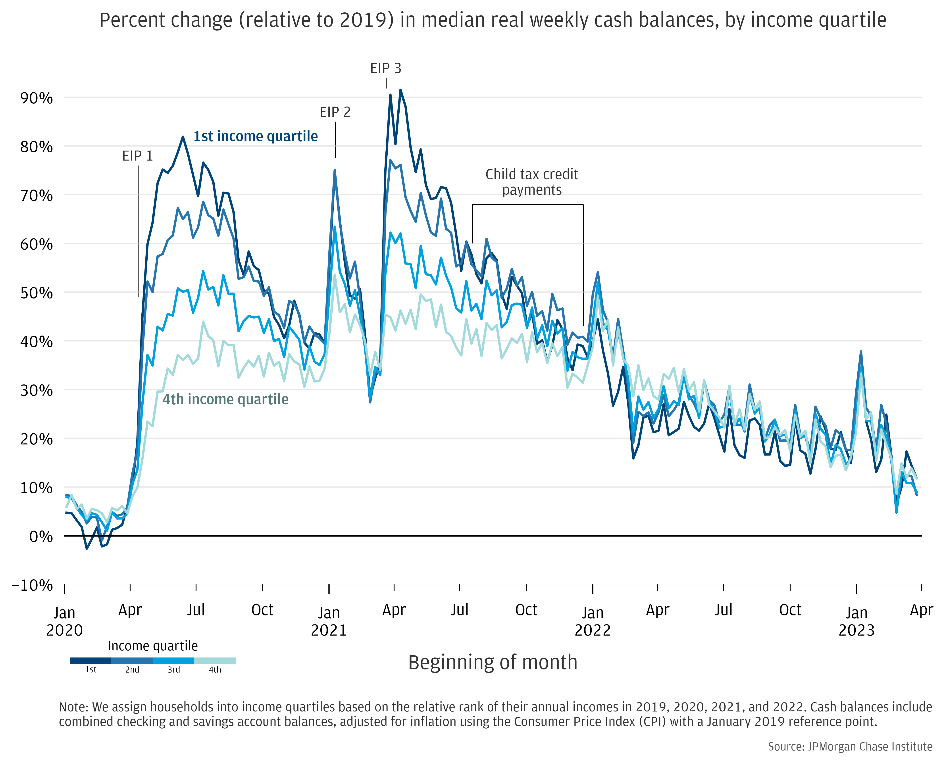
This is confirmed by the most recent data out of Las Vegas, where gaming revenues, one of the most discretionary of all expenditures, declined in both April (3.4%) and May (1.7%), the most recent data available, as compared with the same period last year. Perhaps softening consumer spending is not surprsing, as the cash savings accumulated during Covid, including the impact of government largesse (read: PPP loans) and lower residential mortgage payments (all those homeowners who refinanced in 2020 and 2021), have mostly run their course. Cash reserves are dwindling, with median account balances at their lowest levels in nearly three years, dropping some 41% from their April 2021 peak, according to JP Morgan.
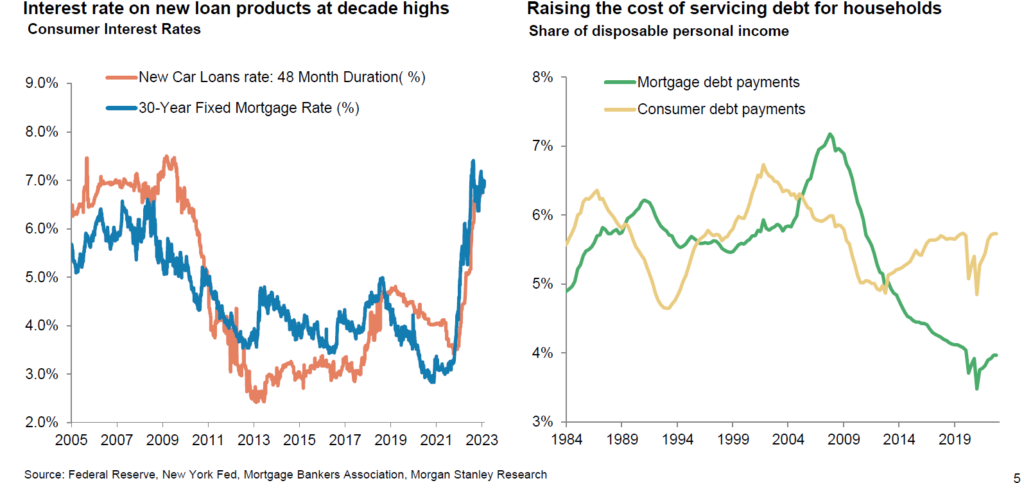
In addition, with higher interest rates on everything from new car loans to credit card debt to mortgages, consumers are feeling an incremental pinch.
On the other hand, having been on more than my fair share of planes in recent weeks, it seems that the consumer is not quite dead yet. Most flights are fairly full and I have to take extra steps to ensure that I don’t end up in that dreaded middle seat (yeah, flying coach is what it is). Data confirms my anecdotal observations, as North American air carrier’s traffic climbed 31% in May 2023 versus May 2022, while the load factor (% of occupied seats) rose 5.1% to 85.1%, the highest in the world. Globally, air traffic is now at 96.1% of May 2019 (B.C., Before Covid) levels, according to the International Air Transportation Association.
What have our wonderful politicians been up to policy wise in Q2, especially with such important local, state, and national elections teed up next year?
•Biden Administration’s New Mortgage Fees: Effective May 1st, new fees made their debut on already lengthy closing statements, as homebuyers with “strong credit” are being charged with higher fees by Fannie Mae and Freddie Mac, to subsidize borrowers with lesser credit. For example, a borrower with a FICO score of 700 and a 20% down payment previously would have paid an upfront fee of 1.25% of the loan amount, say $3,750 on a$300,000 mortgage. Now that fee has been increased to 1.375%. Generally speaking, lesser qualified borrowers will still pay higher fees, but the relative difference is lower. Presumably the objective is to make homeownership more affordable for lower-income borrowers, but I loathe these particular sorts of redistribution efforts, because I have always believed that the obsession with that “American Dream” of homeownership and specifically, that three-bedroom, two-bathroom, three garage home (gotta have room for the boat or Harley), is misguided.
•California Lawsuit Against Elk Grove: In early May, the State filed a lawsuit against the city of Elk Grove, in Sacramento County (near the state capitol), for denying a proposed66-unit affordable housing project. Meanwhile, the State exercised its political influence in getting San Francisco to approve three projects that had been subject to public opposition, including one 450-unit tower. Meanwhile, the State owns 7.6 million acres of property, including something like 58 million square feet of office space, much of which is under-utilized, if used at all. However, the sheer number of California’s 2023 Housing Related
Legislative endeavors are so voluminous that I can’t nearly summarize them all here. However, if you are so inclined, you can follow this link for a complete list and graphical summary, which looks like some of Picasso’s finest work. I just recommend that you fasten your seat belt and grab a glass of your favorite alcoholic beverage before doing so:
https://www.dropbox.com/s/6cnpm11spdoqc2x/CA-housing-bills-20230611.pdf?dl=0
•Montana Legislation Limiting Local Governments from Implementing Rent Restrictions: On the other hand, in May, Montana became the 33rd state to pass legislation limiting local governments from trying to implement rent restrictions, coming on the heels of similar legislation passed in Florida at the end of March and Ohio last June. Of course, other states, from California (of course), Maine, Maryland, Minnesota, New Jersey, and New York are behaving quite differently. According to the National Apartment Association, there are eighty-three state bills out there that would regulate rents. But bills do not legislation make, so we shall see, but I have warned of this inevitability for years. Politicians will do tenant bidding, so long as there are more tenants than landlords who vote.
And finally, what else has been going on in this wacky world that may impact commercial real estate?
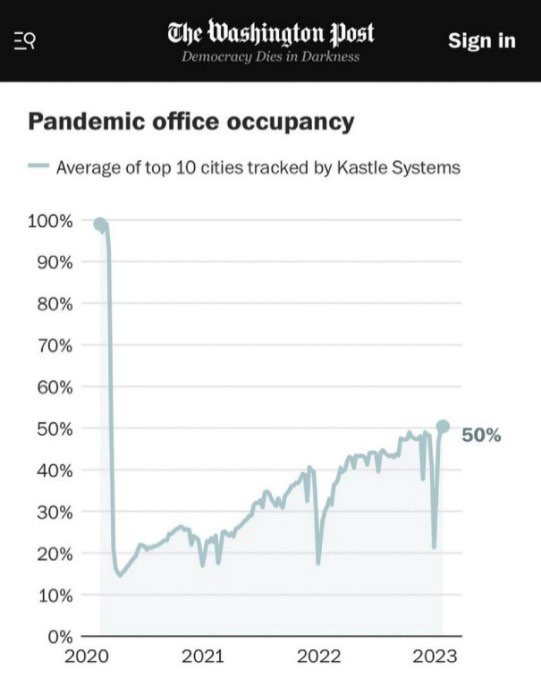
•Commercial (office and retail) property woes continue, surprising nobody: Changes in work and shopping habits continue to wreak havoc on related property markets. UBS estimates that around 50,000 retail stores will close in the U.S. in the next five years. Bed, Bath, and Beyond will shutter about five hundred locations in total. The value of malls is down 19% in the past year and 44% since 2016. And the office horror story is well known, with values down 25% or more across the board, with occupied space per worker down 12%from 2015. Regarding specific submarkets, Chicago saw a jump in office sublease availability jump 7.7 million square feet in the first quarter, which pales in comparison to San Francisco’s 8.9 million square feet, a 140.5 percent increase since 2020. The Los Angeles office vacancy rate reached 22.5%, a historic high, while the vacancy rate increased to 17.1percent, up from 16.9% at the end of 2022. The percentage of Washington D.C.’s office market that is available for lease jumped to 21.7%.
•Student Loan forgiveness: In mid-2020, during the throes of the Covid pandemic, the federal government suspended required payments on nearly $1 trillion of student loans. The moratorium was meant to last six months (or roughly the length of a Kardashian marriage),but like so many government policies, it lasted far longer than intended. The moratorium was extended eight times, of course, which is comical. Don’t get me wrong. I fully understand the argument that the government has a history of forgiving debt (e.g., PPP loans) and bailing out corporations, the old “what’s good for the goose is good for the gander” argument, though I don’t necessarily subscribe to it.
In any event, student loan payments recommence in September, at long last, which will curbsome consumer spending, at least on the margin. In addition, the Supreme Court recentlyruled that President Biden did not have the unilateral authority to forgive some $400 billionin student loans without congressional approval. In response, the Administration announcedthat it will forgive $39 billion of such loans under a different, income-driven proposal, whichwill more likely pass muster and judicial review. We shall see. The important takeaway isthat many consumers will be required to service debts with funds they were previously ableto spend on other goods and/or services…including rent (presumably).
•Deficits and Debt Ceiling Negotiations: I am not sure if you have ever seen the billboard-sized display on Sixth Avenue between 42nd and 43rd Streets in midtown Manhattan, which provides a running total of our nation’s gross outstanding debt and each American family’s share of it. I am also not sure it quite compares with Lady Liberty, the Empire State Building, or Grand Central Station in terms of tourist attractions, but you certainly can’t miss it if you happen to stumble upon it. Anyhow, when this unusual “clock” made its debut in 1989, our debt approximated $3 trillion. Here is a more recent picture, sobering as it might be. You will note that the clock still begins with a “3,” but there are more digits after that:

I mention this in the context of both the recently completed debt ceiling negotiations, which can charitably be labeled a “_hitshow,” as the agreement to raise the ceiling by $4 trillion merely allows us to borrow enough to pay existing obligations and fund government operations for the next two years. So, let’s dispel some misconceptions right off of the bat. One, the negotiations and accompanying agreed-to spending cuts do virtually nothing to balance the budget. Sure, it will cut spending by some $1.5 trillion over the next decade, but the agreement doesn’t lay a hand on areas of real spending: Social Security, Medicare, and defense, three outflows that collectively represent nearly 80% of our annual federal budget. And there’s the rub.
While I appreciate the political sensitivity to making cuts (or significant changes) to these programs, I don’t see any way that we can’t, at least without substantially raising taxes. We spend six times more per senior than per child, trading off social security benefits and education, but let’s be clear. That tradeoff simply isn’t sustainable as the costs of entitlements increase, our population ages (I have written a lot about that in prior letters, our so-called “baby bust”), we have fewer younger workers, and the government collects far less taxes. Tax collections have predictably fallen, following the passage of the 2017 Tax Cuts Job Act (TCJA). At some point, our politicians on both sides of the aisle are going to have to face the music, sacrificing politics for national fiscal security.
Figures from the Congressional Budget Office, which coincidentally don’t anticipate recessions, crises, or understated required infrastructure investments (think conversion of auto industry to electric), tell just a part of the story. In any event, I find the graph below to be just a tad frightening, perhaps even more than most driver’s license and high school yearbook photos.
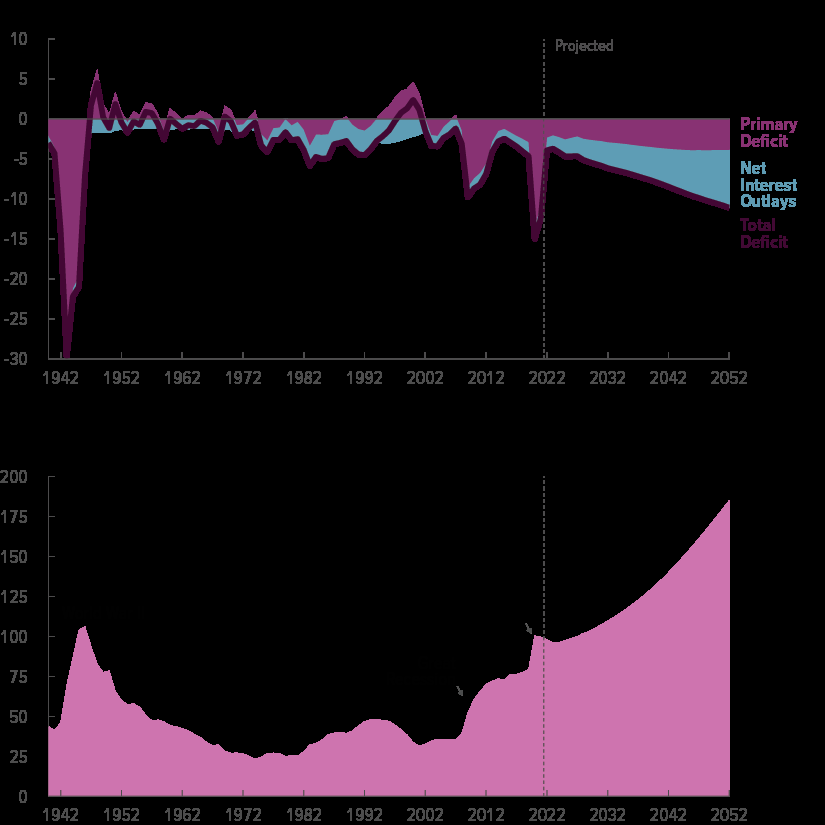
Something has to give, as the gap between revenues and outlays widens over time, mainly because of rising interest costs and growth in Medicare and Social Security spending, resulting in ever-widening budget deficits. After World Wars I and II, we repaid debt by raising taxes and cutting expenditures. Compare that to today’s mindset, which seems completely different, and both parties to blame, of course. Even before Covid, in an economy characterized by record high stock prices, strong housing and commercial real estate markets, and low unemployment and inflation, we still ran a deficit, in part due to the TCJA. In any event, if the federal government does ultimately decide to face the music, raise taxes, and reduce spending, the impact should be materially deflationary, all else equal.
•Artificial Intelligence (AI) and real estate: Unless you have been living under that proverbial rock (and if you have, I sure hope it isn’t in Phoenix), 2023 might be labeled “The Year When AI Became Mainstream,” with the release (or at least popularization) of ChatGPT. At this point, it is hard to say how AI will impact commercial real estate, but you can bet your bottom dollar (or your favorite cryptocurrency) that it will be impactful in the following areas:
-Location, location, location: AI companies and related jobs and infrastructure investment will cluster around established tech markets, universities, and innovation centers.
-Increased demand for certain types of assets: AI research and development will require more and perhaps distinct types of data centers, energy grids and related infrastructure.
-New asset and product types: The AI transition will spur the development of new types of commercial properties, or at a minimum, significant investment in existing product types (e.g., office, industrial) just to make them AI-compliant. Think about the last time you saw an individual staffing a parking kiosk. Smart cameras and related security systems will replace uniformed officers. Or consider how hotel lobbies will change as the need for in-person interactions (e.g., check-in, check-out, concierge services) changes.
-New/Changed underwriting processes: AI-will substantially automate underwriting and the understanding and analysis of markets and individual properties. Individual acquisition personnel will still be needed, if just to exercise judgment and interpret data, but I suspect investors and sponsors will require less human engagement in the underwriting process.
-Design and space function: AI will allow engineers, architects, and other related professionals to more efficiently and quickly design and customize spaces and settings.
In my career, I cannot recall a market with so much conflicting data, adding to investor uncertainty and making predictions no easy task. However, while challenges lay ahead, crises and down cycles inevitably provide opportunities.
If one were to watch the news (or media outlets that hold themselves out as such), pay attention to certain polling, or read your weather app, you might think the sky is falling, the planet melting, and a recession around the corner. In fact, according to a recent Wall Street Journal poll, a large majority (78%) of individuals polled “do not feel confident” that their children will be better off than they were, the highest percentage since the survey began in 1990.
With all the negativity emanating from everyone from politicians to media outlets to my mother-in-law, such pessimism is understanding. Interest rates remain high and volatile, and while recent inflation data looks promising, it is too early to declare victory. Consumers will be more stretched and challenged in coming months, as cash reserves dwindle, student loan repayments resume, and the cost of consumer debt remains high. The disruptive potential of AI and negative psychological influence of social media only add to the understandable angst. And commercial real estate investors, capital providers, and all other industry participants are going to be busy working through a longer trough of this particular downcycle. There is no escaping this reality.
However, from GDP figures to employment levels to real wages to corporate profits and equity markets, it appears that a recession is not in the cards, at least for the time being. However, that could change quickly if the Fed continues to wield the interest rate sledgehammer, causing additional disruption to investors, lenders, and capital markets, generally. But let’s be clear. Our economy has done and is doing pretty darn well, all things considered, especially relative to the rest of the world, despite news and rhetoric to the contrary.
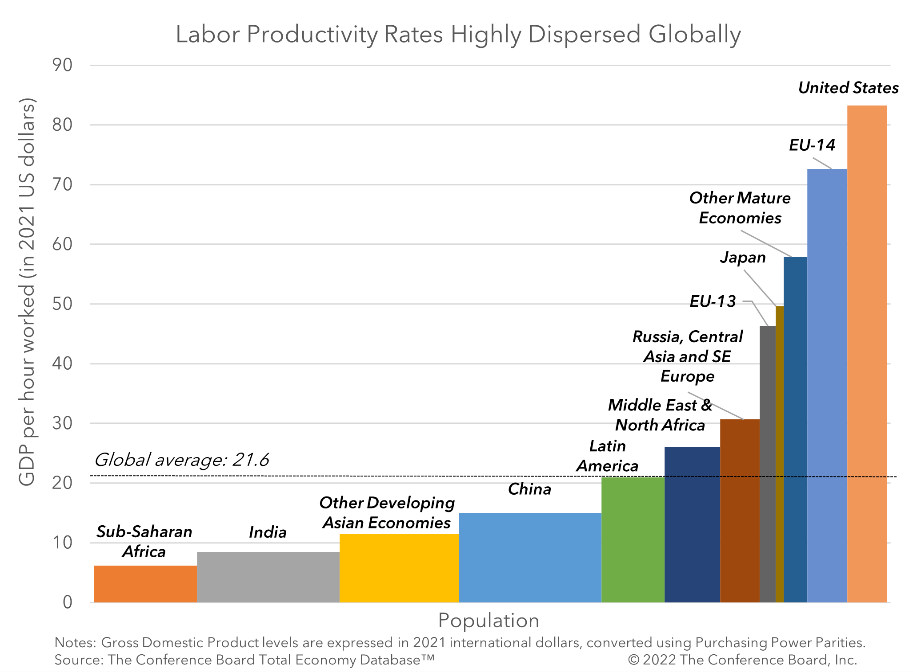
In 1990, the U.S. accounted for a quarter of total global output, essentially the same percentage today, even in the rising power and influence of China and India. We represent nearly 60% of the collective GDP of the G7, the most of all other developed nations. Our economic productivity is much higher than that of Europe or Japan. American companies own more than 20% of patents registered abroad, more than China and Germany combined.
Regardless, and as I stated in unequivocal terms last quarter, we are more than cognizant of the challenges that lie ahead and are acting accordingly in all aspects of the business. As I mentioned earlier, our portfolio is mostly tracking to budget and plan, at least on operations. Debt service, including reserves for interest rate caps, on our floating-rate debt is a different story, and we continue to pursue options to convert this debt to fixed rate via cash-in refinancings. Ironically, while higher interest rates cause debt service pain, we benefit from higher rates inasmuch as the cost of renting becomes far more favorable vis a vis buying.
Meanwhile, we do not intend on ignoring potentially attractive acquisition opportunities when they present themselves, though they are certainly not easy to find (bid-ask spreads between potential buyers and sellers remain wide), and transaction volume has declined substantially, consistent with the loan data I provided earlier. According to CoStar, multifamily sales volume fell 74% in the first quarter of the year, the largest year-over-year drop since the first quarter of 2009, at or near the trough during the Great Financial Crisis. We were pleased to acquire the attractive three asset, Inland Empire based portfolio here in Southern California in an off-market transaction and are still soliciting investor capital for that particular transaction, so I hope you might take a look at that opportunity.
Finally, thank you for supporting the firm and its endeavors, even in these challenging times. Rest assured we take our role as a fiduciary seriously and will continue to do our best navigating these tricky times and markets, providing our views, perspectives, and relevant market and property-specific information in a timely and transparent fashion, which I hope is part our corporate DNA. Please feel free to reach out to me or a member of our investor relations team (Aimee DeFord and Tania Mirchandani) should you have any questions, concerns, or other needs regarding either your existing investments or opportunities we are pursuing.
Best,

Eric Sussman
Managing Partner
“There is nothing more deceptive than an obvious fact.”
-Sir Arthur Conan Doyle
“Value-add multifamily real estate is a canvas of potential waiting to be transformed into a masterpiece of profit and social impact.”
–Fictional quote created by ChatGPT
“Uncertainty is the only certainty there is, and knowing how to live with insecurity is the only security.”
-John Allen Paulos
I have often said that the only constant in life and markets is change and my, oh my, did the first quarter of 2023 live up to that adage, trite as it might be. In what seemed to be the blink of an eye, we had the beginning and apparent passing of a banking crisis, the introduction and seemingly widespread use of ChatGPT, an eerily effective artificial intelligence tool, and the historic indictment of a former president. To put it in college basketball terms, we experienced several March Madness moments during the most recent quarter. These whiplash-like news events echo that famous quote from one of the characters in Ernest Hemingway’s, “The Sun Also Rises,” who responds when asked about his financial woes and how he went bankrupt: “Two ways. Gradually, and then suddenly.”
Since there are lots of newsworthy tidbits to cover, perhaps I should just get on with it and summarize the highlights, or lowlights, from the quarter.
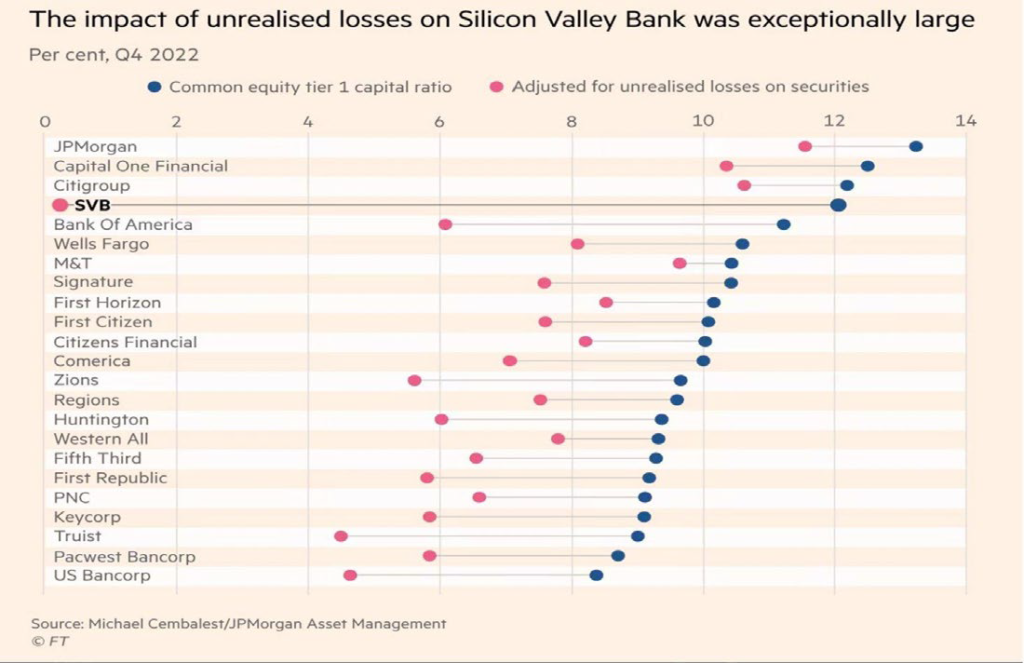
• In a matter of days in mid-March, Silicon Valley Bank went down the proverbial tubes following a bank run (or perhaps more aptly described as a “mouse click stampede”), representing the second largest bank failure in U.S. history and the largest since the Great Financial Crisis. Two days later, Signature Bank, not wanting to miss out on the fun, was also forced to close its doors. A combination of poor risk management (mismatching of asset and liability duration, excessive investment in shorter-term Treasuries and/or long-term fixed rate loans) and related unrealized losses, technological change, anachronistic FDIC insurance and financial accounting rules, and underlying bank fundamentals (e.g., high leverage, thin margins, asset illiquidity) not only sealed their fates, but revealed fundamental risks across the entire banking industry, especially among smaller, less diversified regional and community banks (e.g., First Republic, Zion’s, Pacific West).
2 | P a g e
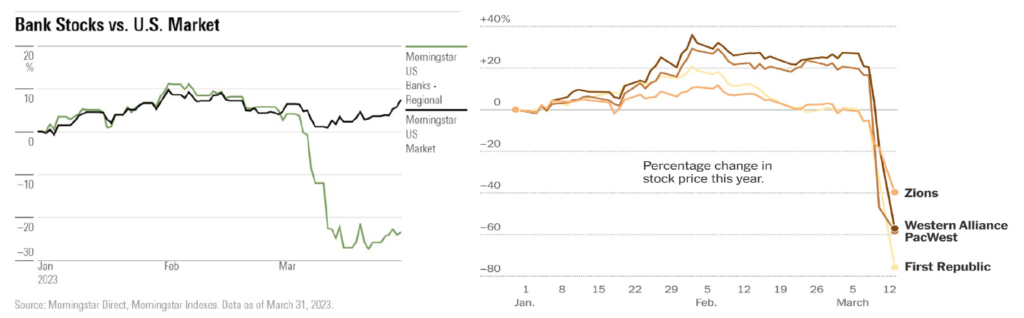
Not surprisingly, bank stocks were crushed during the quarter, with the KBW Nasdaq Bank Stock Index down nearly 35% year-to-date. The impact of these recent events will reverberate during the remainder of 2023 and 2024 through decreased bank profitability (if not additional failures), reduced lending activity, and increasing withdrawals of deposits, all increasing the risk of recession and overall systemic risk.
Across the pond, Credit Suisse, the global investment bank and financial services firm, was purchased by UBS in a bailout transaction brokered by the Swiss government. Bank runs and related contagion are indeed a thing. Fortunately, quick Fed intervention and the collective efforts of other banks to prop up competitors apparently saved the day here at home, at least for the time being.
Specifically, a group of 11 financial institutions, including B of A, Well Fargo, Citigroup, and JP Morgan agreed to deposit a total $30 billion in First Republic to demonstrate confidence in the banking system and First Republic, specifically. I cannot recall ever witnessing anything comparable. Sure, Warren Buffett and Berkshire Hathaway lent $10 billion to Goldman Sachs and General Electric during the Great Financial Crisis, but that was quite a different story. In any event, bank stocks seemed to substantially stabilize during the last half of March. Given the recent positive earnings announcements from JP Morgan and Citibank, it may end up being a “tale of two types of banks” or the financial equivalent of Beauty and the Beast, where large, diversified, money center banks end up benefitting from the market turbulence at the expense of smaller community and regional institutions.
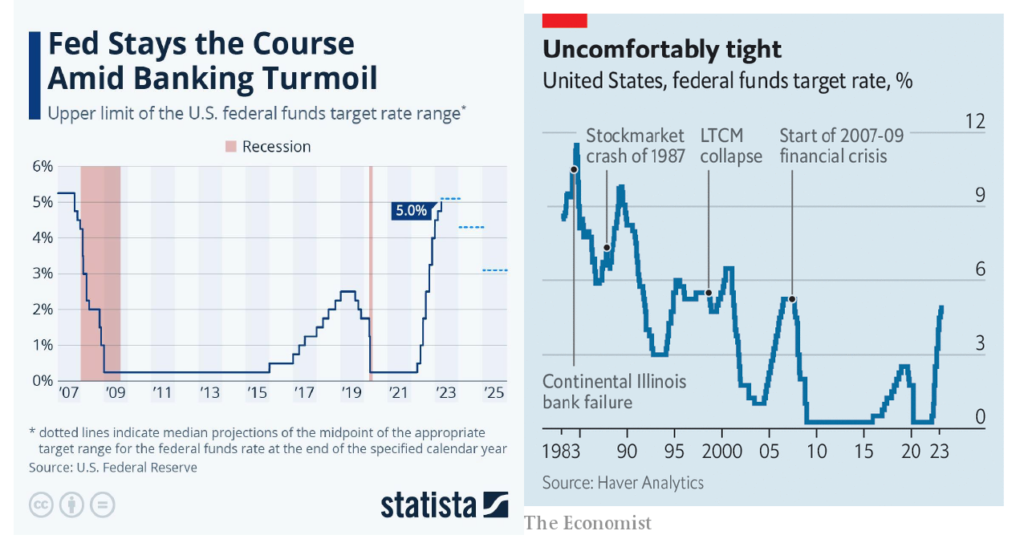
• The Federal Reserve, in the wake of the crisis, short-lived as it might have been, was compelled to rethink its sledgehammer interest-rate strategy and better balance potentially competing objectives of reining in inflation while minimizing strain on and risk of failure of member banks. The Fed agreed to backstop all deposits at both Silicon Valley and Signature Bank and “only” increased the Federal Funds Rate by 0.25% last month, instead of the 0.50% increase that had previously been anticipated. While the Fed has indicated that one more rate increase is likely this year, no one should be counting them chickens before they hatch. As I have said many times, Fed Chair Powell is trying to thread one very challenging needle.
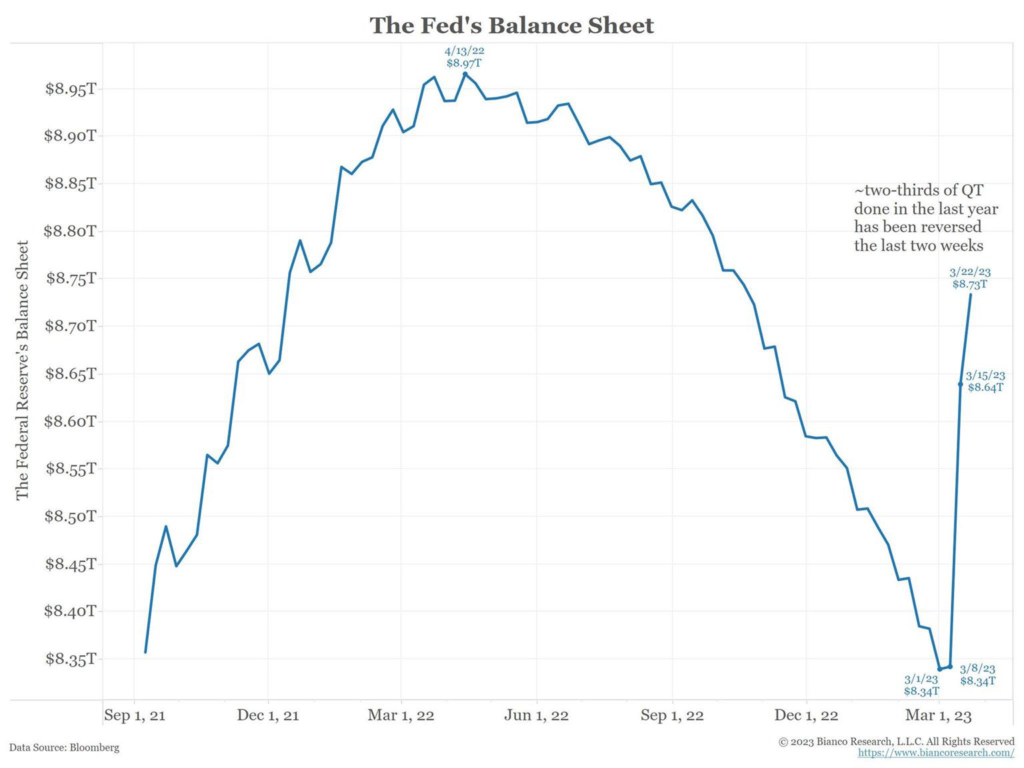
Meanwhile, this aggressive, if not wholly responsible and reasonable Fed response, comes at a cost, of course. The Federal Reserve’s largesse and unprecedented money-printing and quantitative easing endeavors in recent years, which bloated its balance sheet from some $5 trillion (yes, trillion, with a “t”) before the pandemic began, to nearly $9 trillion last April, has been materially responsible for the inflationary pressures we have experienced over the past 18 months or so. Through subsequent monetary tightening efforts, the Fed had successfully shrunk its balance sheet to $8.3 trillion by the beginning of March. And then came the banking shenanigans, the Fed’s response, and in a mere two weeks, some two-thirds of the Fed’s tightening endeavors had been undone. The best laid plans of mice and the Fed, I suppose.
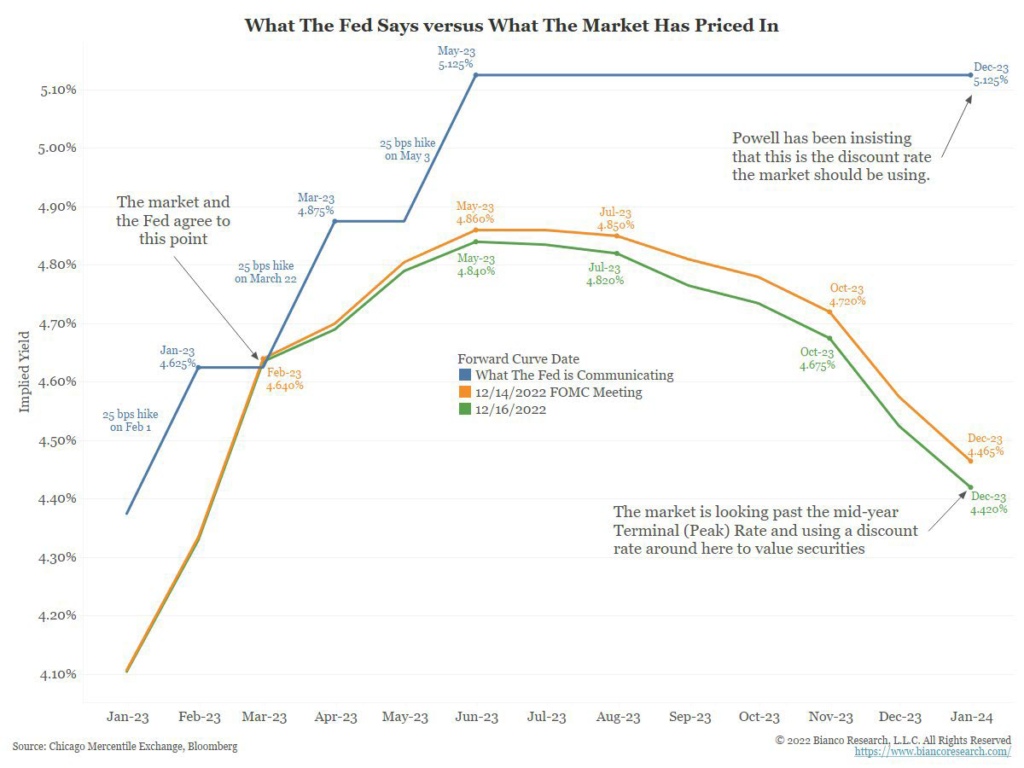
So, where does the Fed go from here? It is hard to say, of course, but there seems to be a disconnect between what the Fed is telegraphing as opposed to what the market is anticipating.
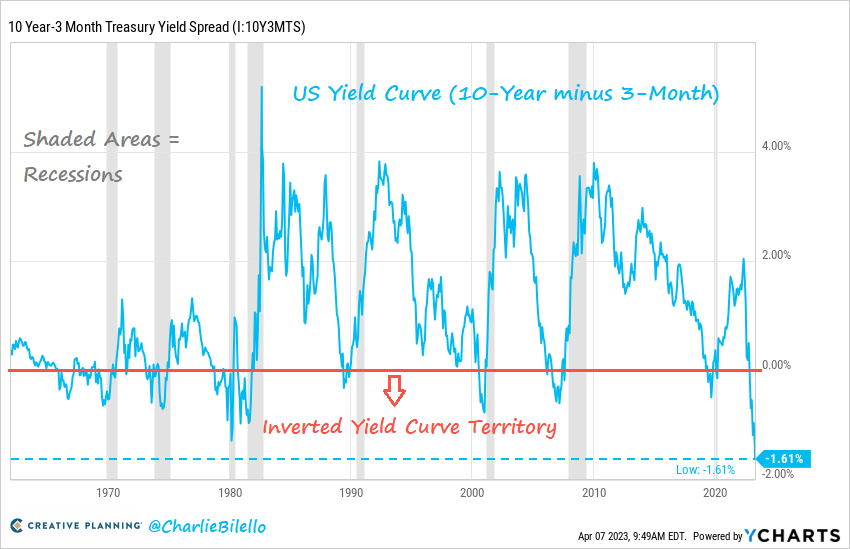
After all, the spread between short- (three-month) and long-term (10-year) Treasuries has never been wider, resulting in the most inverted yield curve in history.
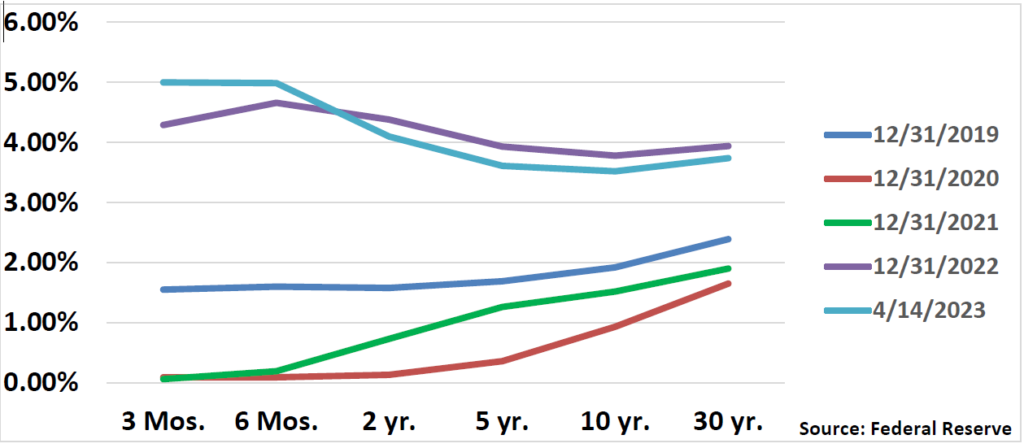
Seen another way, longer-term Treasury rates on two- and ten-year maturities have not changed all that much since the beginning of the year and are actually modestly lower, but rates on the shorter end of the curve have risen. Such a steep inversion would almost certainly foretell a significant economic slowdown, if not recession, but the equity and labor markets (see below) do not seem convinced.
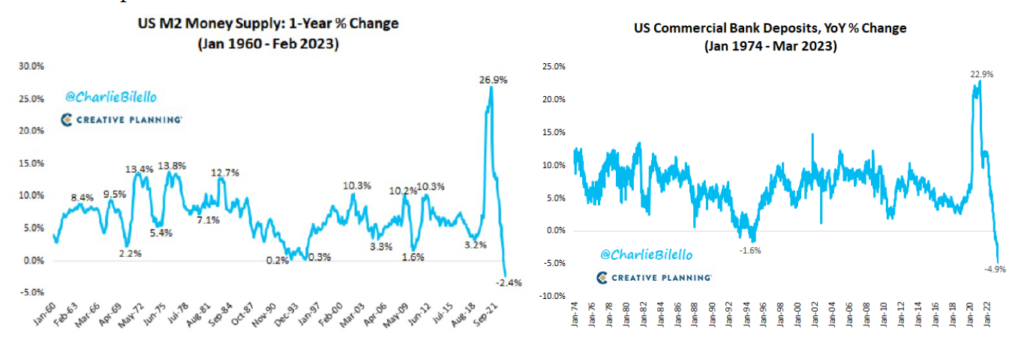
• M2 money supply, in turn, witnessed its largest decline in history during the quarter, as depositors pulled funds from banks in record numbers, preferring risk-free (read: principal-protected) Treasuries and non-bank money market funds versus potentially at-risk bank deposits. It is my strong view that the Fed needs to revisit the anachronistic FDIC-insured limits, which were last changed following the Great Financial Crisis. There is no way that depositors can adequately assess the financial risk of banks in which their deposits are held. That would be asking too much of even this CPA and accounting professor, let alone other depositors, and arguments about moral hazards do not seem very compelling to me, at least when it comes to depositors. Employees, management, Board members, and capital providers (debt holders and stock owners) should individually and collectively bear the risks of bank failures, in my view, not depositors.
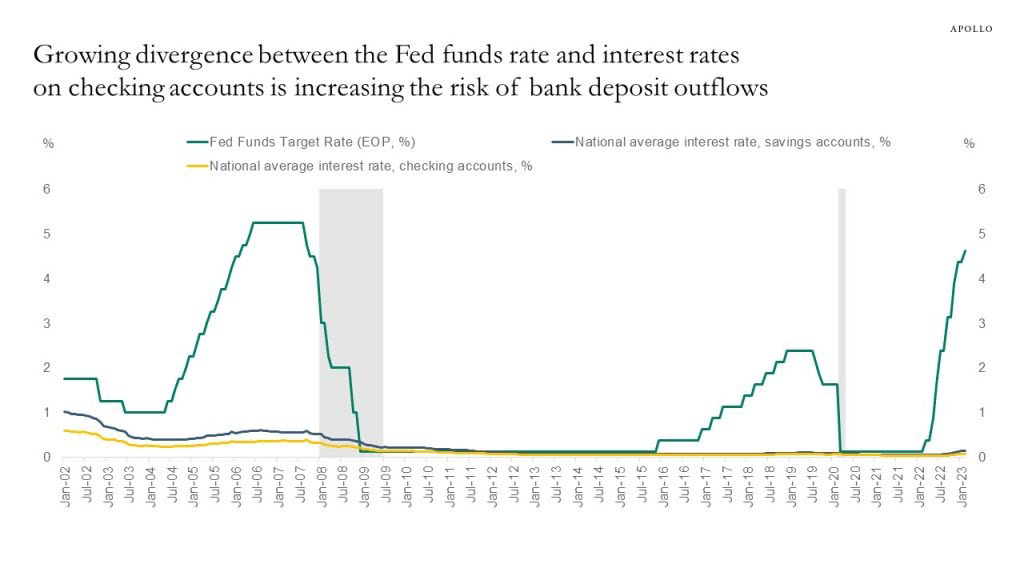
In any case, let’s be clear. The entire banking system remains at risk and subject to whimsical shifts in depositor confidence and psychology, especially given the wide spread between yields on short-term debt securities (think two-year Treasuries) and the Fed Funds rate, both of which approximate 5.0%, and rates banks are willing to pay on many demand deposits, something between jack and squat, keeping in mind that significant balances of these demand deposits are likely uninsured under current rules.
Finally, record levels of commercial mortgages come due this year and next, about $500 billion each year, much of which is held by those smaller regional and community banks, those with less than $250 billion in assets. It remains to be seen how many of those loans are repaid, extended, or ultimately defaulted on, given the significantly higher cost of capital, declines in commercial real estate values, and weakening fundamentals. Maturing commercial real estate loans will provide a worthy adversary to bank balance sheets, especially in the event of increasing delinquencies and/or defaults.
• Housing prices remain firm, though one can argue that it is a tale of different housing markets and different time periods. In all 12 of the major housing markets west of Texas (Austin), home prices declined in January, year-over-year. However, prices actually rose in all markets to the east. Perhaps, it is partly a question of what goes up, must come down (or at least revert to the mean), but the disparity more likely reflects the relative difference in job markets within these geographic locations. Specifically, most of the job losses announced since last year have been in the tech sector, so markets with disproportionate exposure to these industries (e.g., San Francisco, Seattle, Los Angeles) have been hardest hit.
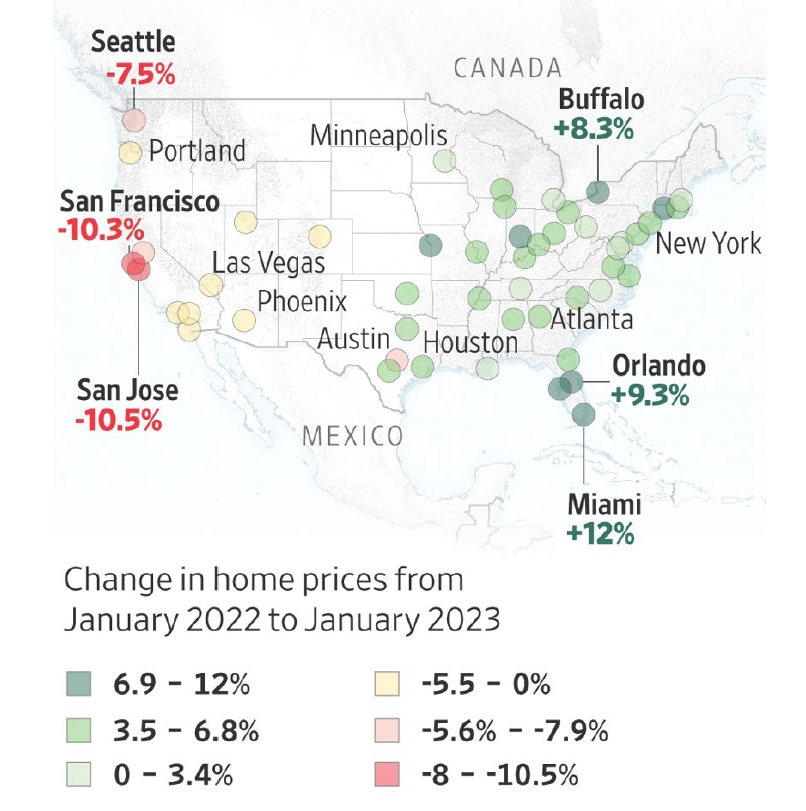
However, just as in so much other economic data, year-over-year figures often mask nearer-term trends. Since last summer, home prices across the country have dropped for seven straight months (through January). From June’s peak, national housing prices have declined about 5.3%, but are down much more in San Francisco and Seattle, 14.8% and 17.2%, respectively.
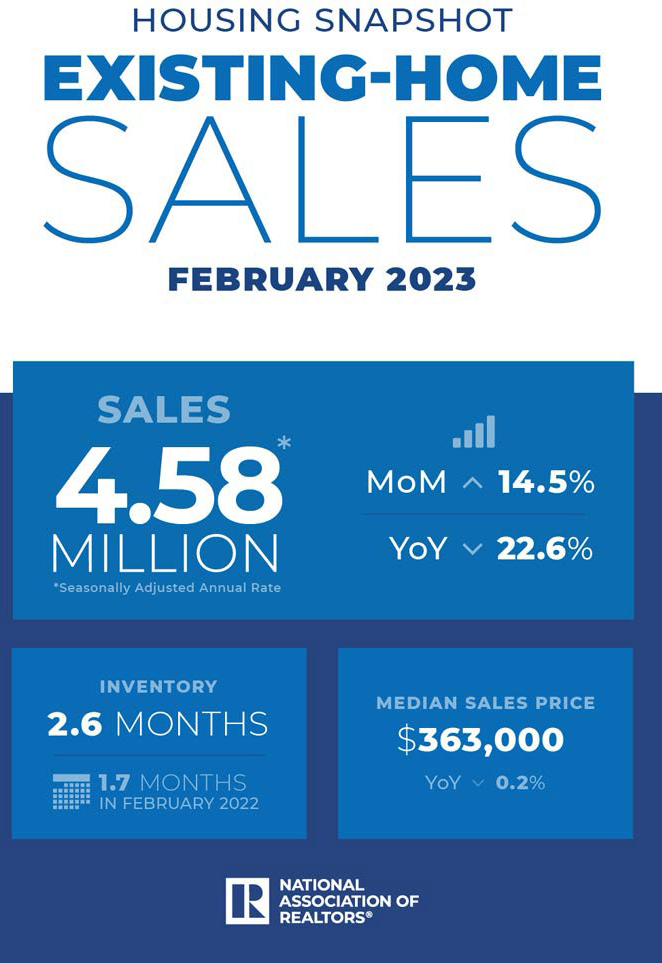
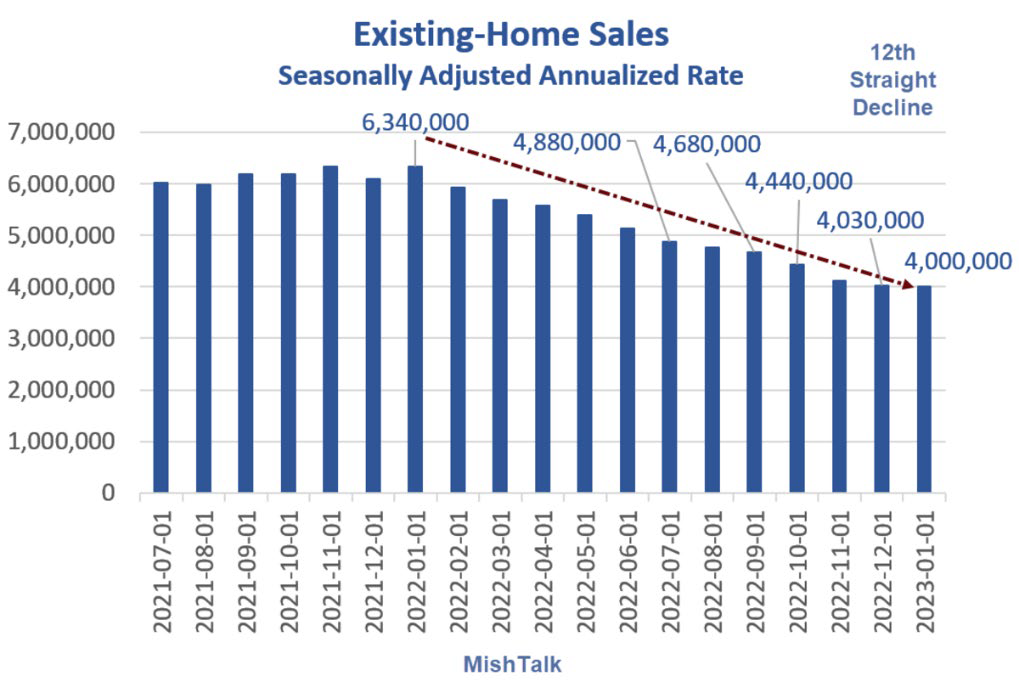
Moreover, all housing pricing data may be a tad skewed because of the sharp drop in transaction volume. Through February, overall home sales are down 22.6% year-over-year, 14.5% from January, and have declined for 12 straight months, whether considering overall or seasonally adjusted data. Higher mortgage rates and declines in consumer (read: homebuyer) confidence are to blame. At last glance, 30-year fixed rate mortgages nationally averaged 6.27%, according to Freddie Mac. While well off the 7.08% rate hit last year, rates are obviously more than double those witnessed in 2021.
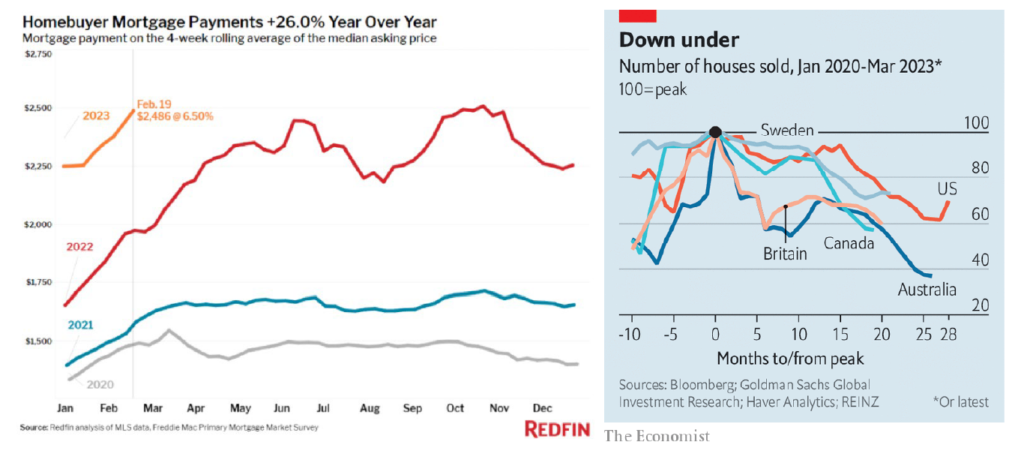
In the U.S., the widespread use of long-term, fixed rate mortgages provides a certain buffer to downside risk, as borrowers are able to better able to meet mortgage obligations and are not forced to sell their homes as a result of short-term financial or economic distress. In fact, anyone who acquired or refinanced a home in 2020 or 2021 is now the fortunate owner of “mortgage handcuffs,” (insert joke here), likely unable or reluctant to sell and/or relocate because any subsequent home they might purchase would require substantially mortgage payments (over 25%). The widespread use of fixed-rate mortgages also explains why housing markets in Sweden, Canada, and Australia, where floating-rate mortgages on single-family homes are far more common, have been hit much harder than here in the U.S.
• Meanwhile, data surrounding multifamily markets is decidedly mixed. According to Redfin, asking rents for apartment units fell in every metropolitan area in the U.S. over the last eight months, reflecting not only normal seasonal slowdowns (August through February are traditionally slow leasing periods), but broader indigestion as several markets which saw significant construction activity must “absorb” new units coming to market. Developers of these new projects are engaged in aggressive lease-up efforts, offering generous move-in specials and rent concessions.
According to Redfin, median rent nationally fell 0.4% in March, year-over-year, the first annual decline since March 2020, the start of the pandemic. Rents nationally are down 3.5% since August, with the largest declines in Austin (11%) and Chicago (more than 9%). Other cities with rent declines of 3% or less include Phoenix, Las Vegas, New Orleans, Houston, and Atlanta. However, rents still remain far higher than before the pandemic, up 20 to 35% in many, if not most, markets. And perhaps more importantly, rents in March appear to have rebounded, at least compared to February, up 0.5%, according to Apartment List. Again, year-over-year data can really mask more recent, and arguably, more probative data points.
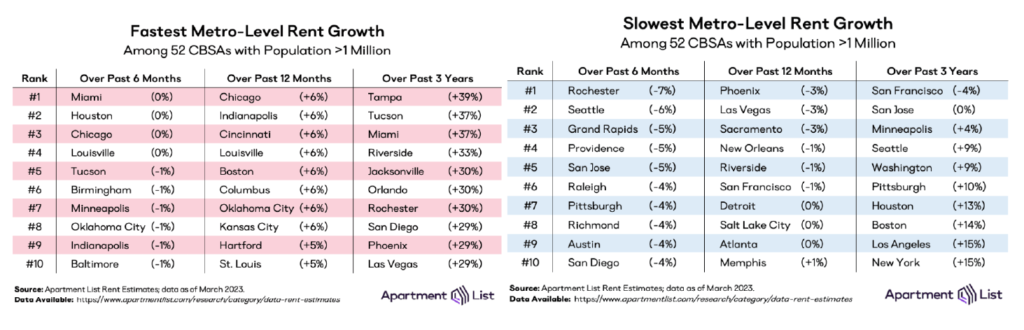
However, while directionally consistent with Redfin, Apartment List’s provides slightly different data regarding specific markets, rental growth (or declines) in said markets, over differing time periods. Anecdotally, those markets with greater exposure to technology and other white-collar jobs (e.g., San Francisco, San Jose, New York, Boston, Los Angeles) and those that experienced the greatest rental growth since the pandemic began (e.g., Austin, Atlanta, Phoenix) are generally those that are experiencing the most modest rental growth, or even experiencing rental declines, at least in recent months.
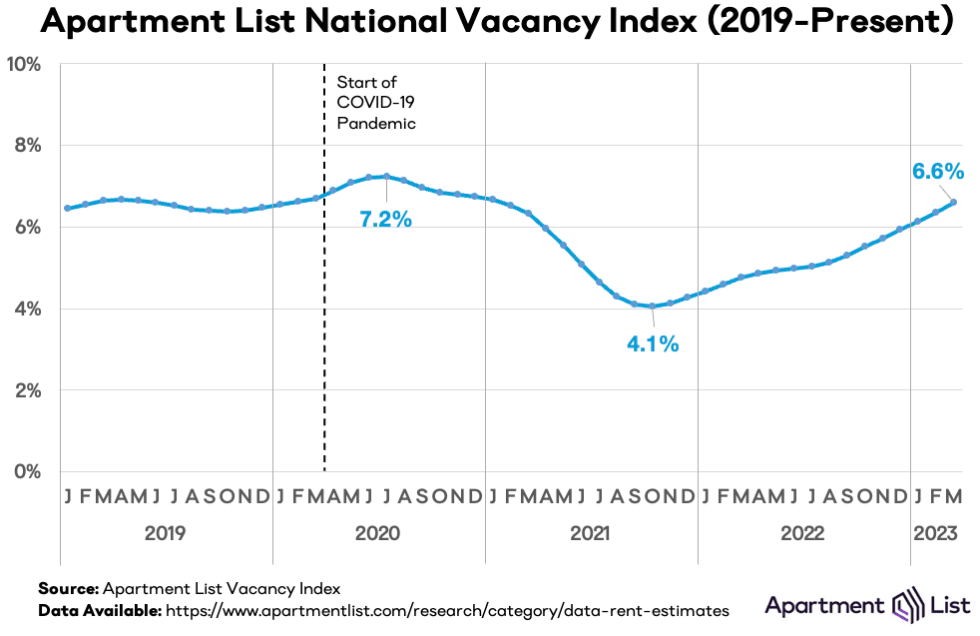
Meanwhile, national vacancy rates ticked up to 6.6%, their highest level since the summer of 2020, again reflecting uninspiring economic growth, higher inflation, and new supply.
Regardless of shorter-term trends or blips, the “affordability gap,” the difference between mortgage costs and effective apartment rents has never been wider, and homeownership remains decidedly out of reach for most, even two-income, white collar- households. But rising interest rates, higher home prices and decreasing inventory aren’t the only things making it difficult to buy a home these days. Last year, nearly a third of U.S. homes were purchased with cash, according to Redfin, likely foreign and/or institutional buyers. That’s an eight percent increase from 2021, continuing a trend that started during the pandemic, and representing levels not seen since 2014, when the housing market was on the rebound following the Great Financial Crisis. The rise of all-cash purchases comes at a time when the average home buyer is increasingly likely to be white, wealthy, and older, with the proportion of first-time buyers at its lowest in more than 40 years.
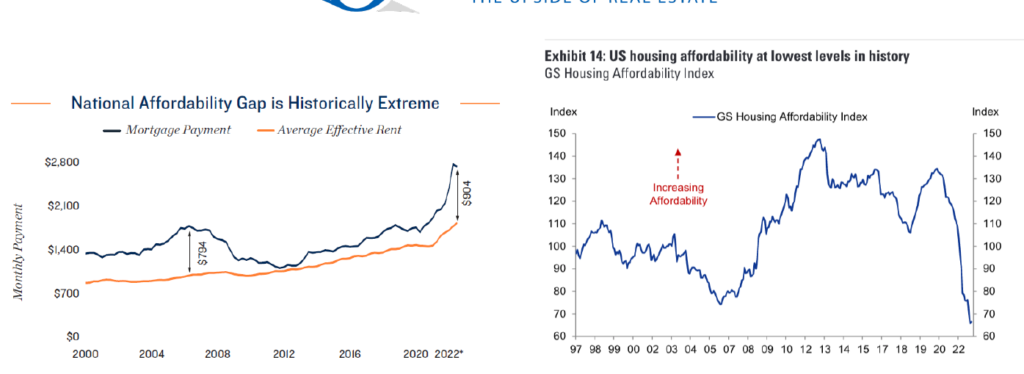
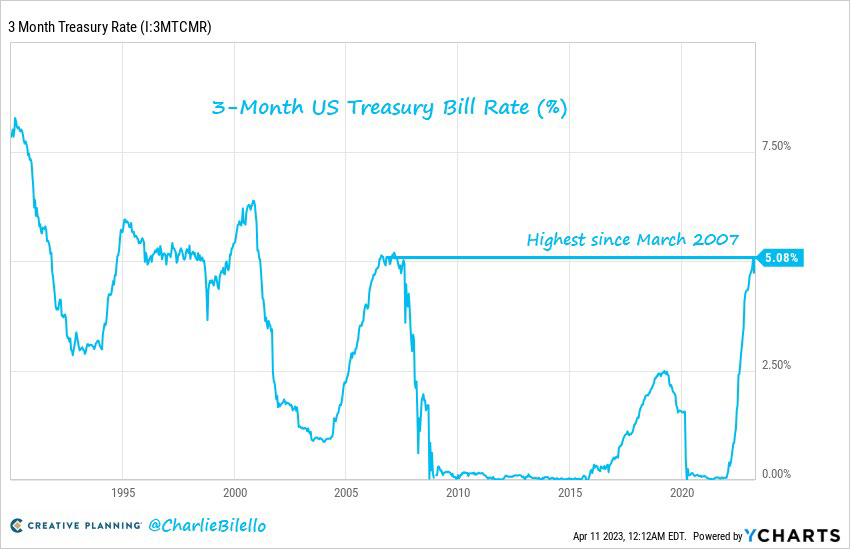
However, higher capital costs and uncertainty surrounding the economy and supply will continue to weigh on apartment valuations and transaction volumes. All property owners, especially those with floating-rate mortgages, are grappling with surges in short-term rates and the increasing costs associated with hedging exposure to such rates (interest rate caps), as yields on both SOFR (Secured Overnight Financing Rate) and 3-month Treasuries have spiked to their highest levels on record, or at least since the period preceding the Great Financial Crisis.
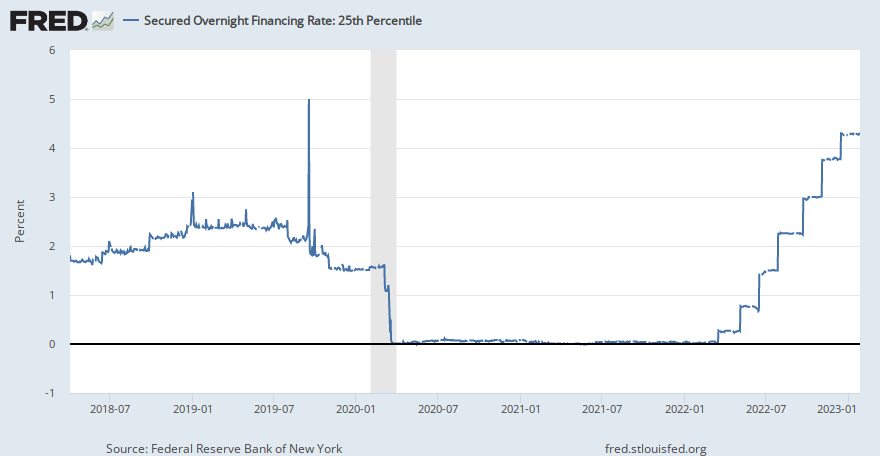
The three-month Treasury Bill yield rose to 5.08% this month (5.06% at last glance), its highest level since March 2007. Keep in mind that the yield on short-term Treasuries was 0.70% a year ago, and a measly 0.02% two years ago. Ouch.
Thus, it is no surprise that some apartment owners are struggling. In early April, a large apartment project in Houston, consisting of 3,200 units, was taken back by its lender in early April. Veritas, a San Francisco based PW firm defaulted on a $450 million loan backed by rent-controlled apartments, and Blackstone is currently negotiating with its lenders on portfolio of apartment buildings in NYC.
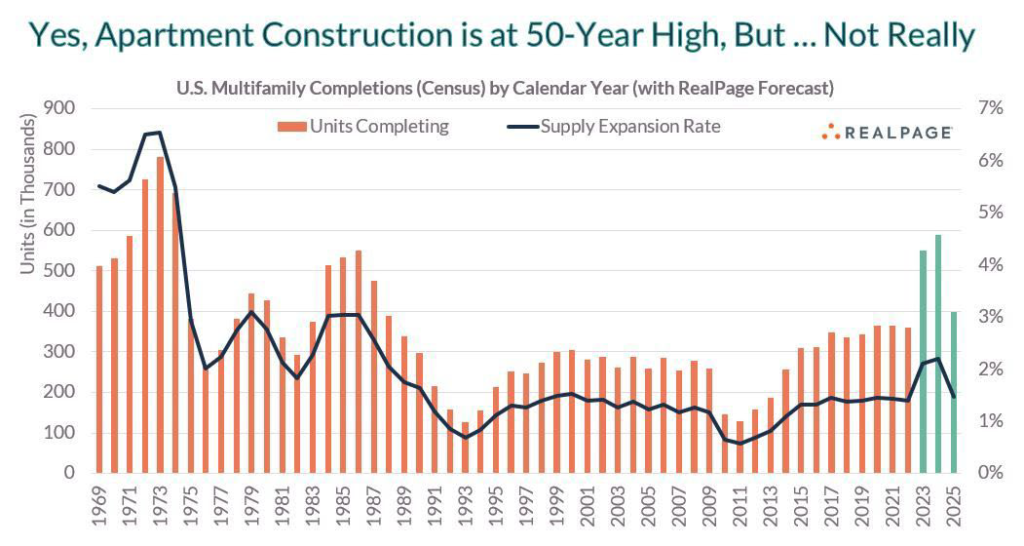
Meanwhile, the multifamily market continues to grapple with increasing supply in several markets. However, while there are about one million multifamily units under construction nationally, one should be cynical when reading headlines claiming that multifamily construction is at its highest level in 50 years, as proclaimed in a recent article published by MHN, Multi-Housing News, since such a claim is inherently misleading or at least incomplete.
For one thing, there are far more multifamily units in the U.S. today than in 1970, so on a relative basis, the increase in absolute construction activity is about a third of what it was in the early 1970’s. Those construction starts in the 1970’s tended to be smaller projects, 20 units or fewer, which were approved and built far more quickly than today. For those of you from Southern California, think about the apartment buildings you routinely see in submarkets like Hollywood, Brentwood, and/or Koreatown. The larger projects which dominate construction starts today take longer to build and bring to market. Finally, the U.S. population has grown significantly since the early 1970’s. For example, there are nearly double the number of adults aged between 25 and 54 today, and those prospective renters or homebuyers reside in different markets than they did back then, reflecting population and demographic shifts, away from both coasts and into markets in the Southwest and Sunbelt, for example.
Now, don’t misunderstand me, as there are a lot of apartments under construction, which along with those higher capital costs and operating expenses (e.g., insurance, labor), are impacting fundamentals and will continue to do so through at least the end of this year, especially in certain markets. However, demand will eventually catch up with supply and with the cost of single-family homes being essentially out of reach for so many, apartments will benefit at least on a relative basis. While the road will be challenging for both developers of new product and operators and owners of existing stock, I believe that the market will stabilize by the end of the first quarter of 2024.
Finally, in what has to be the single most exciting headline in the multifamily space was the news that a local Southern California developer is planning a mixed-use project with apartment units atop a Costco. Imagine, renting an apartment above Costco. You wouldn’t need an on-site gym. Walking the aisles of Costco and lifting cases of drinks and water bottles would provide all the exercise one might need. You could live off of free food samples. If ever one might find heaven on earth, I believe this particular development, if it comes to fruition, would nearly qualify.

• The commercial real estate market, especially the office sector, saw significant weakness and a large number of foreclosures during the quarter, principally in gateway cities: New York, Los Angeles, Boston, and San Francisco. Few landlords can withstand the double whammy of significant increases in interest rates and weakening fundamentals, which will create additional stresses on operators and lenders in coming quarters. As discussed in greater detail below, to say that the fundamentals in the office sector are not pretty would be a profound understatement. While being a multifamily owner/operator/developer is challenging these days, these challenges pale by comparison to those landlords or operators in the office sector.
This quarter my inbox was flooded with one anecdote or headline after another, each highlighting woes in the office market. Here is just a sample, and trust me, this is (sadly), just a sample:
- “Pac Mutual Building in Downtown LA hits the market at half its previous price”
- “Google Parent Alphabet to spend $500M cutting office space this quarter.”
- “California Government to Trim 132 Office Leases”
- “Distress in Office Market Spreads to High-End Buildings”
- “Blackstone unloads two 13-story buildings in Southern California at a big discount”
- “Brookfield defaults on two Los Angeles office towers”
- “Pimco-Owned Office Landlord Defaults on $1.7 Billion Mortgage”
From Los Angeles to New York to Boston to San Diego to Washington D.C. to nearly everywhere in-between, the office market is in a depression and heavily distressed, experiencing rapidly declining rents, increasing vacancies, and comatose-like transaction volume. Shockingly, there are still a fairly large number of new projects coming to market, nearly 124 million square feet across the country, projects that had already been approved, financed, and begun before the turmoil started, so the beatings will continue for some time.
Billions of square feet of office will probably be obsolete by 2030, reflecting significant overbuilding and a greater shift to hybrid work. Sure, some projects will be repositioned, converted to other uses (e.g., healthcare, medtech, housing), but I remain dubious as to whether obsolete office buildings can be practically converted, and in most cases, I suspect buildings will remain vacant for years, ultimately razed and rebuilt for other uses. Impediments from zoning, architectural/design limitations, lack and cost of available financing for such projects, will simply be too great to overcome.
And retail real estate? It is not faring that much better, though the end of the Covid pandemic is certainly a positive for the sector. During the quarter, I read that Simon Property Group, the largest retail landlord in the country, defaulted on a $295 million loan on a 1.2 million square foot shopping center in Orange County, California, and poor Brookfield, repeating its experience on certain office assets, defaulted on a nearly $80 million shopping center loan in Washington state. There is no question that this will be the most challenging commercial real estate cycle since the 1970’s and I see no proverbial light at the end of the tunnel.
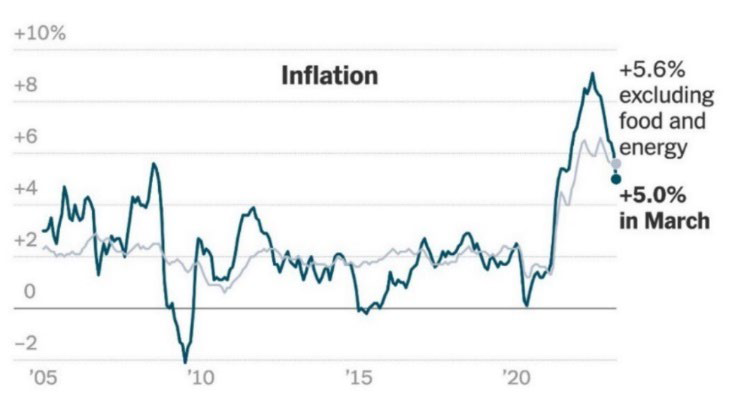
• The Consumer Price Index increased a modest 0.1% in March from the previous month, or 5.0% year-over-year, representing the ninth consecutive decline in year-over-year inflation figures and the lowest inflation levels seen since May 2021. Core inflation (excluding volatile food and energy prices) increased 5.6% year-over-year, driven in large part by continued increases in shelter (housing) costs, which increased 8.2% year-over-year.
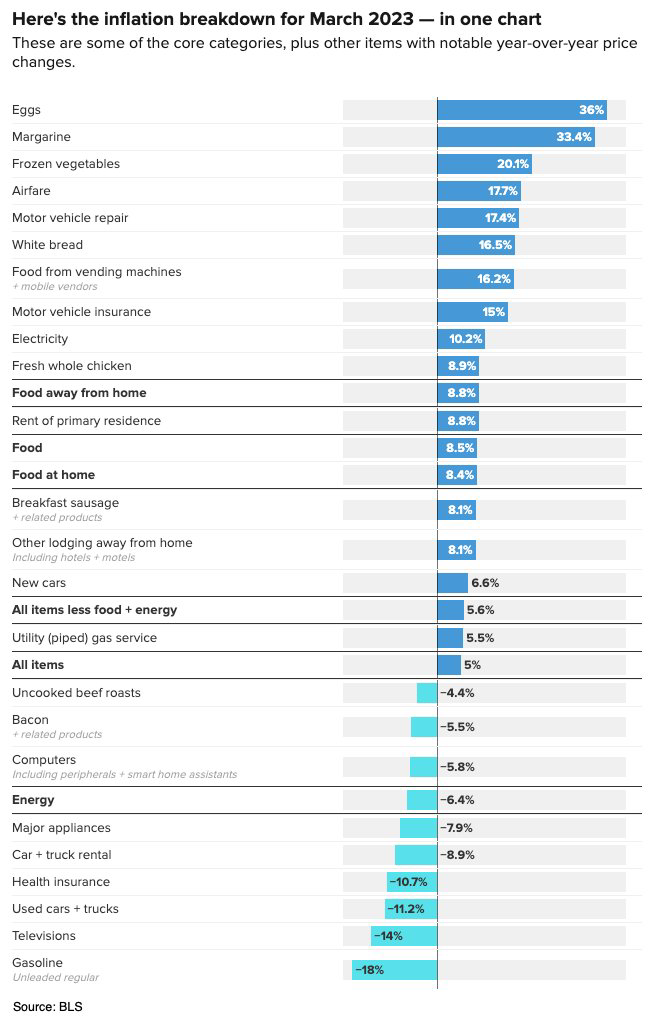
With apologies for the size of this next chart, it provides a more granular and insightful breakdown of the yearly inflation change. However, one should exercise caution in drawing conclusions from year-over-year figures because they can obviously mask shorter-term trends that are perhaps more likely to persist going forward. For example, while egg prices rose an astounding 36% between March 2022 and March 2023, they fell 7% in February and another 11% in March. Thank goodness! One can only eat so much oatmeal, Cheerios, and avocado toast, even in California.
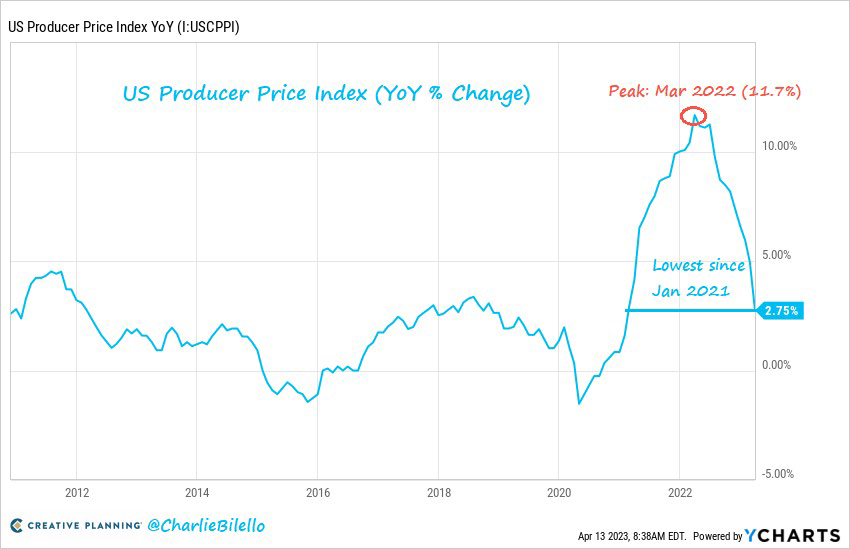
Meanwhile, March 2023 producer prices increased “only” 2.75% over the last year, the smallest increase since January 2021. By comparison, producer prices increased 11.7% in March of 2022 (versus the prior year), so costs have been declining, at least among domestic producers.
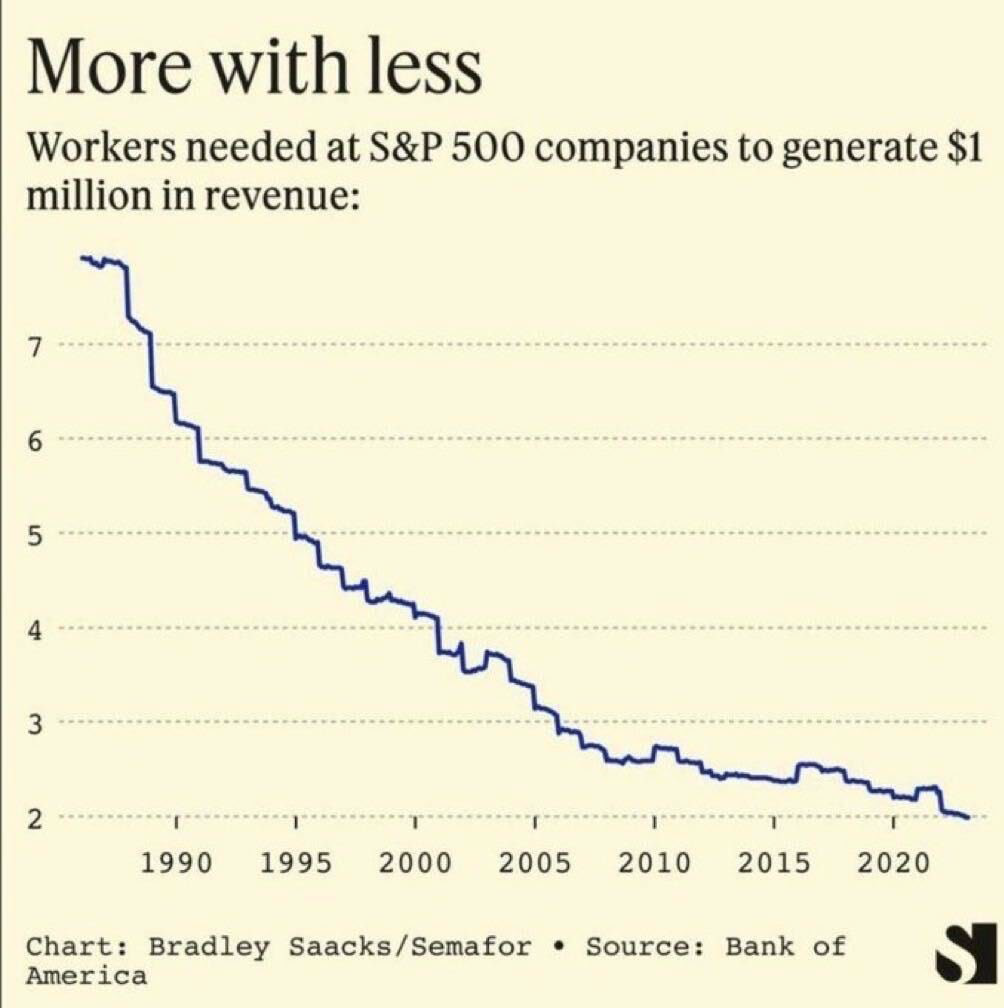
Where inflation goes from here is obviously a big question mark. On the one hand, decreases in housing/shelter costs and in lending activity, coupled with broad demographic and population changes are broadly deflationary. In addition, the continued trend towards automation and yes, AI, should prove deflationary with related changes in labor markets, as evidenced by this interesting graph. Firms require far less workers to generate substantial revenue than in the past.
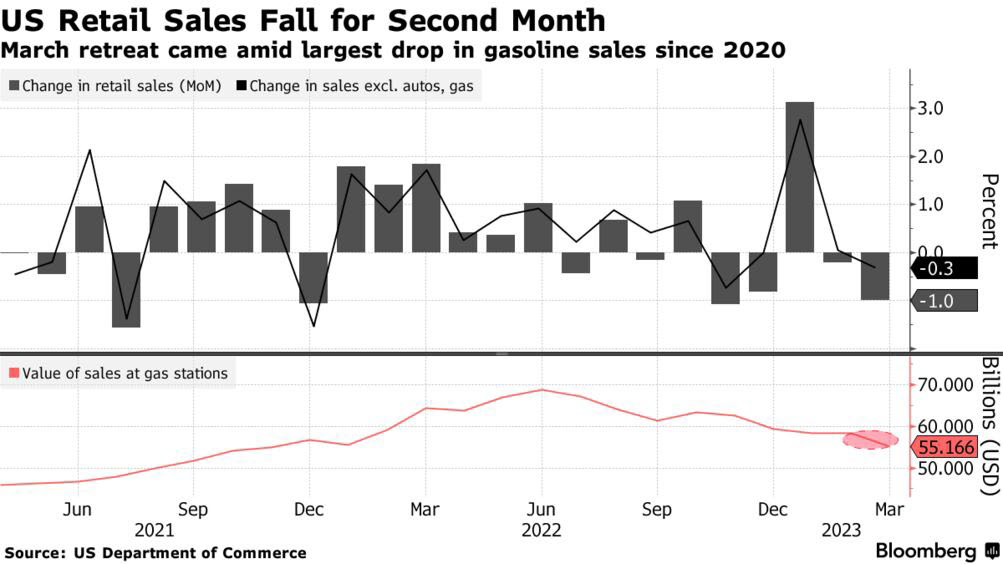
Finally, the consumer seems to be losing some steam, perhaps having finally expended their PPP funds, unemployment benefits, and Covid-related savings when spending dropped like a stone. U.S. retail sales increased only 1.5% in March over the last year, the lowest growth rate since May 2020 and well below the historical average of 4.8%. After adjusting for inflation, the story is worse. Real retail sales fell 3.3% over the last year, the 7th consecutive year-over-year decline.
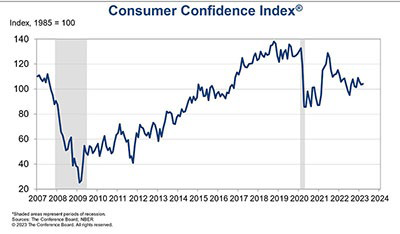
However, data surrounding certain discretionary spending appears contradictory. On the one hand, although I have not been to Las Vegas in recent months in order to obtain data supporting the Sussman Spa Bookings Index (SSBI™), my favorite measure of discretionary spending, I couldn’t help but note that Nevada casinos won nearly $1.24 billion in February, a new record for the month. On the other hand, Darden Restaurants, in a recent earnings call, indicated that households making less than $50K annually were eating less frequently at its Olive Garden and Cheddar’s restaurants according to data, echoing similar comments made by Walmart. Now I realize many reading this memo are not frequent consumers of endless bread sticks at Olive Garden (shame on you), but the anecdotes are consistent with overall trends in retail sales. Recent headlines, especially woes in the banking industry, have understandably weighed on consumer confidence.
In perhaps the scariest data point, “professional economists” (as opposed to the unprofessional or amateur ones) recently surveyed by the Wall Street Journal, project that inflation will slow to 3.1% by end of 2023. My cynicism about such polls is well documented, but if you need any evidence as to how difficult predictions are, not a single one of the economics professionals accurately predicted where interest rates would be at the end of 2022 and not a single number one seed made it to the Final Four in this year’s March Madness. Of course, had my beloved Bruins hoopsters did not sustain the injuries that they experienced and received a number one seed, I am confident we would be hanging up another banner in Westwood. Oh, well. As Andy Dufresne said in the Shawshank Redemption, “Hope is a good thing, maybe the best of things.” I have always liked that quote.
• The job market, while softening, still appears robust, providing a recessionary buffer. The March job report was solid, with an increase of 236,000 new jobs (non-farm) added, slightly exceeding expectations. The unemployment rate fell to 3.5%. Year-over-year average hourly wages increased 4.2%, slightly below the 5.0% inflation rate.
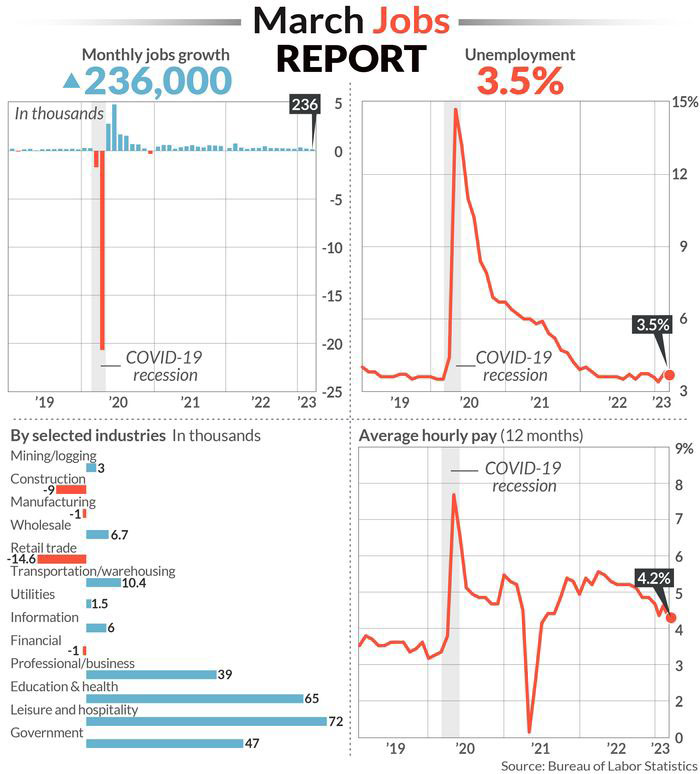
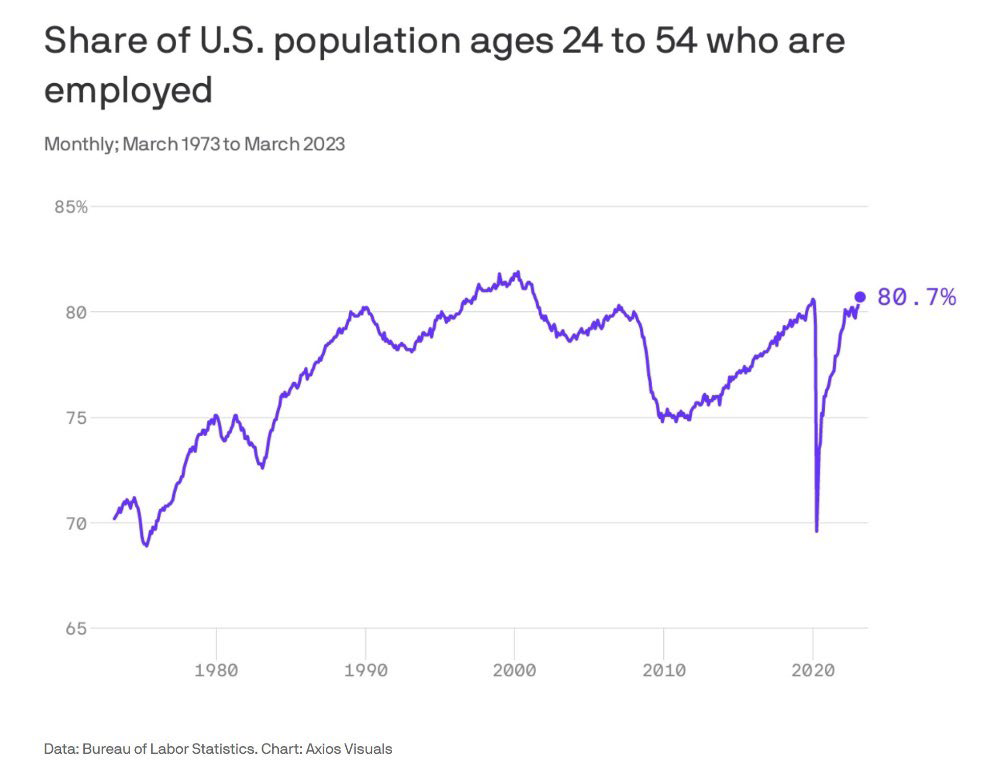
With Baby Boomers (those born after WWII) retiring, we are witnessing labor shortages that many have previously warned about. How do we find more nurses, teachers, bus drivers, and those willing to work in the construction trade (e.g., carpenters, plumbers, electricians)? Who will rebuild the bridges and roads in desperate need of repair, especially when we are already at or near full employment and our immigration policy remains a political football? The share of the U.S. population between 24 and 54 who are employed reached an all-time record in March, approaching 81%, so there is not a heck of a lot of additional labor supply to be found here.
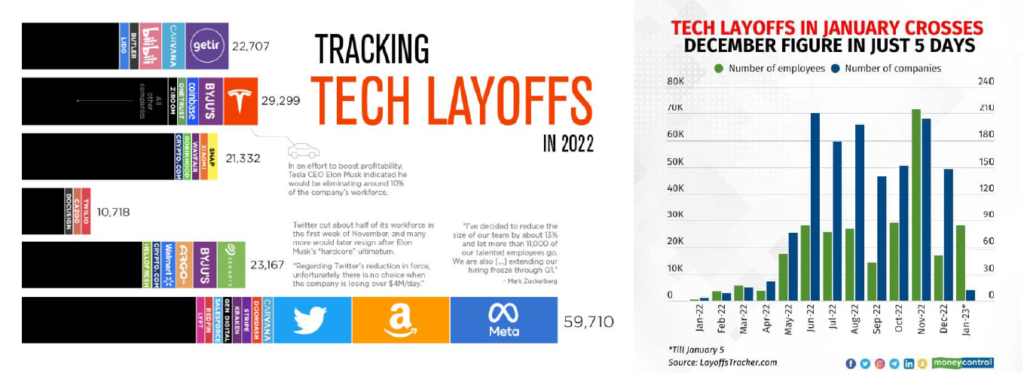
But is not all peaches and cream in the labor markets as layoffs also continue to accelerate, especially in tech, banking, and real estate. Thus far, many laid off workers have been able to find other work, but I am not sure that will remain the case. The running total of layoffs for 2023 based on full months to date is 168,243, according to Layoffs.fyi. Tech layoffs to date this year currently exceed the total number of tech layoffs in 2022, according to their data.
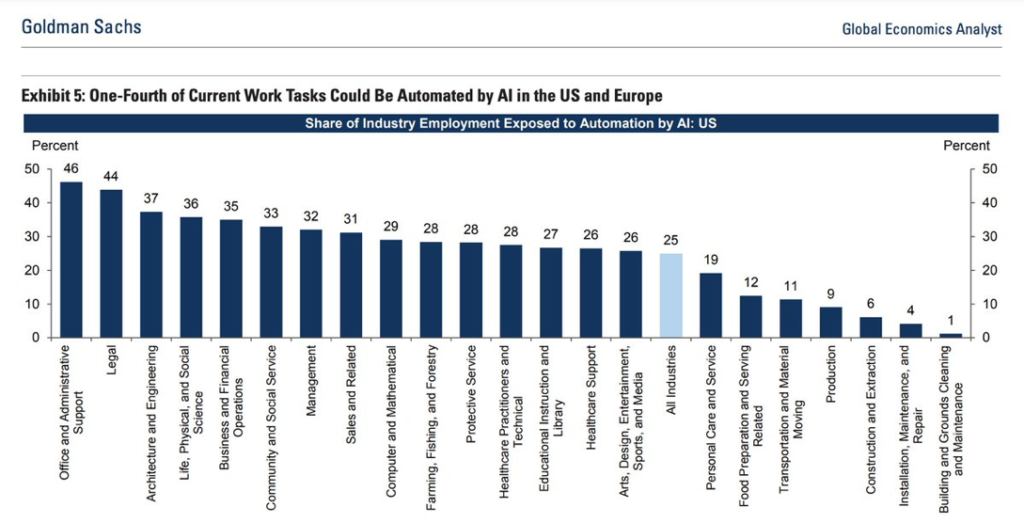
How will AI impact labor markets now and looking forward? This is, perhaps, the most significant uncertainty surrounding employment over the coming years and remains to be seen, of course, but in the meantime, I am relieved that both business school faculty members and managers of financial services firms are not likely to be replaced, at least for a little while.
So, why are so many Americans sour on the economy when labor markets remain reasonably robust, and the stock market continues to hold its own?
I recently came across some data, released by a conservative think tank (please forgive me, liberal friends), American Compass, and an index it created and labeled, the “Cost of Thriving Index” (COTI) Essentially the index begins with a simple foundational premise, that households must prioritize five sets of goods: food, housing, health care, transportation, and higher education, a sort of modern-day take on Maslow’s hierarchy of needs.
The COTI strives to measure how the median American family is doing in terms of its ability to afford these goods, by looking at the cost of these five items back in 1985 versus today, comparing them with the median wage someone 25 and older and working full-time would earn, and finally, how many weeks it would take for that wage earner to pay for them. The data and conclusions are sobering, but informative, with two pictures communicating a thousand words.
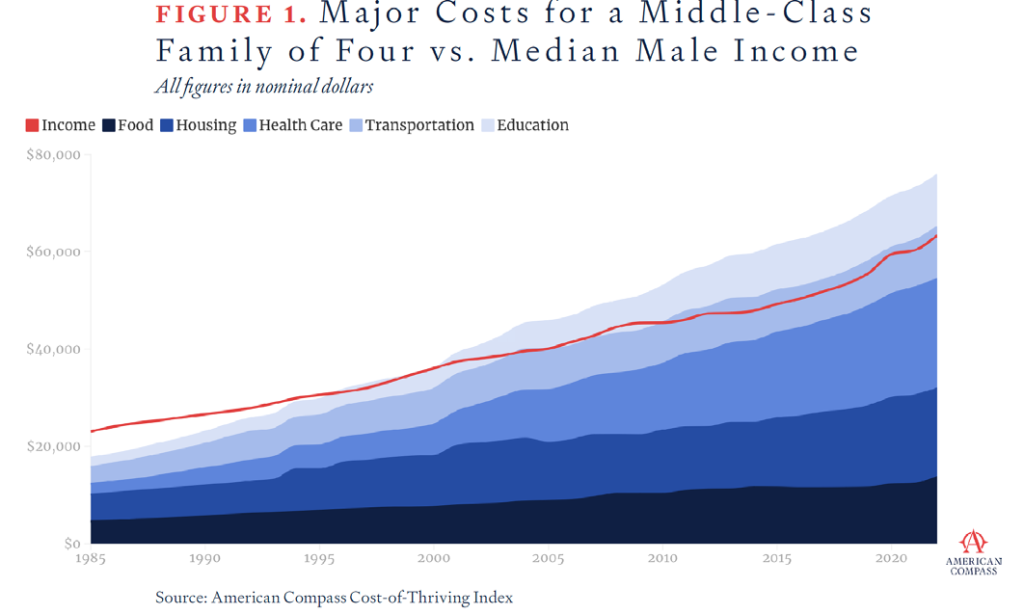
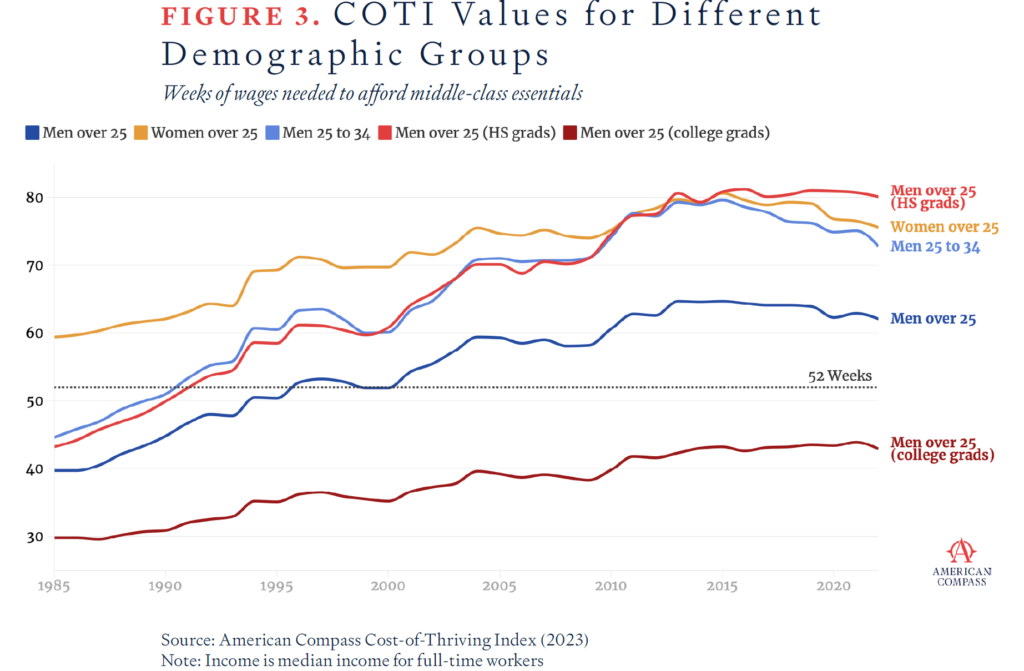
Here’s the upshot. In 1985, it took about 40 weeks of work per year to pay for these things, giving families room to enjoy other consumer goods and luxuries. And today? It takes more than 62 weeks to afford these same costs. You don’t need to be an expert in the Gregorian calendar to realize the issue. The bottom line is that the median American family simply cannot afford what one would consider life’s necessities on a single middle-class paycheck.
For years, I have written about wealth inequality, the differential between the “haves” and “have-nots” Those with assets – principally, equities, bonds, and real estate – have become richer and richer, creating a wider disparity between themselves and the middle class. So, perhaps the declines in stock prices (since the beginning of 2022), fixed income securities, and more recently, commercial real estate values, along with the substantial job losses in technology, banking, and real estate represent a sort of “richsession” as several publications have described it, a sort of rebalancing, if you will. Blue collar jobs in trades, services, hospitality, and leisure continue to thrive, unions are gaining more traction, and government relief programs, including eviction moratoriums and expansion of rent control (see below), have expanded significantly in recent years, consistent with the thesis.
Either because of, or in spite of, political divisions and broad economic forces (read: wealth inequality), local, state, and our D.C.-based politicians seem eager to promulgate one housing related policy after another, generally benefitting renters at the expense of landlords or property owners
I have predicted for years that the most fundamental premise that “there are more tenants than landlords who vote” and housing has become increasingly unaffordable would result in increased expansion of rent control and inclusionary zoning, along with greater rights afforded tenants facing evictions. According to the National Low-Income Housing Coalition, 32 states and 73 municipalities have passed new tenant protections, just since January of 2021.
• National “Renters Bill of Rights”: Almost right on cue, President Biden rolled out a proposed ‘Renters Bill of Rights’ in January as a potential push for federal rent control. Not surprisingly, these efforts have been spurred by the Progressive wing of the Democratic caucus, though it remains to be seen whether the push will result in actual legislation or formal policy change. I suspect it is mostly window dressing and no substantive new national policy measures are forthcoming. After all, for certain types of FHA financing, restrictions are already placed on landlords, generally requiring that units be rented only to tenants satisfying certain income tests. And states are, for better or worse, promulgating their own regulations. For example, the Wisconsin and Economic Development Authority and Pennsylvania Housing Finance Agency agreed to cap annual rental increases to 5% per year for federal- or state-subsidized affordable housing.
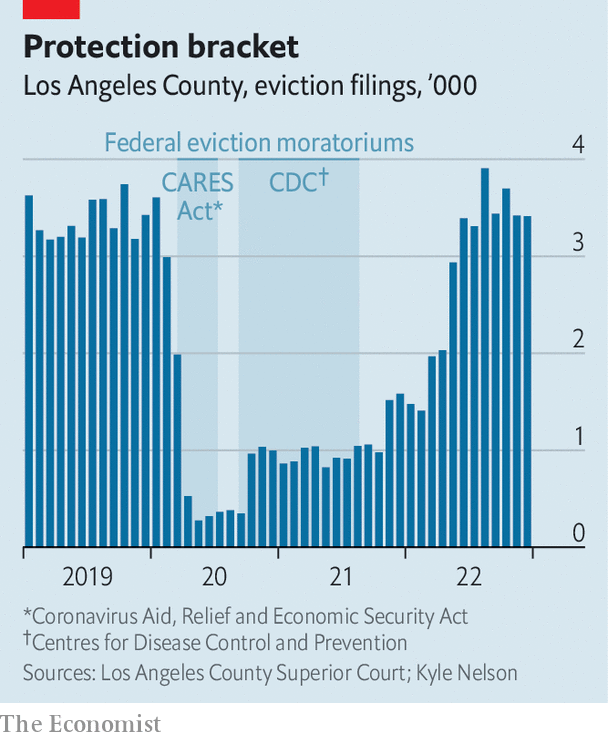
• End of Covid-related eviction moratoriums…or not: One week before they were set to expire, the Los Angeles County Board of Supervisors extended by two months its tenant protections against eviction for those impacted by COVID-19, while also approving the establishment of a $45 million relief fund for small landlords who have been unable to collect rent from some tenants. At this point, the last phase of Los Angeles’ rent eviction moratorium will end in June 2023. Imagine that. The end of June, months after President declared the national Covid emergency over, and months after every other state had already lifted its eviction restrictions. Understandably, the extension was met with anger from property owners, while The Apartment Association of Greater L.A. (AAGLA) filed a lawsuit against the city to overturn and stop enforcement of the new ordinances that make it more difficult to remove tenants as well as penalize landlords for raising rent.
One ordinance in question stipulates that at least one month’s rent be past due before initiating eviction proceedings. The other forces landlords to pay relocation fees if rent is raised by at least 10 percent or by five percentage points over the rate of inflation, whichever is lower, and results in a tenant’s displacement. That includes paying three times the fair market rent of the unit plus $1,411 in moving costs. Call me a cynic, but I don’t think AAGLA will get much traction in the Los Angeles Superior or local District Courts.
• New York rent regulations upheld by federal appeals court: In New York, rent regulations and restrictions were upheld by federal appeals court, supporting decades old policy impacting about one million apartments. In short, the Second Circuit Court of Appeals rejected a challenge by landlords to state law passed in 2019, which made it much more difficult for landlords to free up apartments to achieve “market” rent. As other courts have found, the Second Circuit determined that rent regulations are not an intrusion on property rights or an unconstitutional taking and that legislatures have broad authority to regulate land use without running aground of the Fifth Amendments bar on physical takings. The Court reasoned that landlords are not restricted from receiving market rents “in perpetuity.” In my view, the Courts consistent justification of restrictive rent policies under land-use guidelines is misleading and another example where judicial ends justify economic means. But I call B.S. on this perspective, since it is not the “land use,” which is at issue, but rather the income stream that is derived from that same use. But realizing that judges allow desired outcomes to influence judicial reasoning and rulings is about as shocking as it was to learn that George Santos wasn’t Jewish or an astronaut.
• Rent-related proposals in Colorado, Massachusetts, and Maryland: As indicated above, several states have proposed legislation to protect tenants or ostensibly increase the affordable housing stock. In Colorado, a bill was recently introduced which would give local governments a right of first refusal to purchase multifamily properties before private parties so long as they commit to rent out units for affordable housing. In another measure, which has passed the State House of Representatives, statewide rent control preemptions would be revoked, allowing local communities to establish their own rent-related policies. In Boston, the City Council passed the mayor’s proposal to cap rent at six percent plus the increase in the Consumer Price Index, up to a maximum of 10 percent. However, state lawmakers still need to strike down statewide rent control preemption. Finally, in Maryland, two major counties appear poised to pass rent controls. In Prince George’s County, which surrounds the eastern half of Washington, D.C., county officials just pushed through a measure temporarily capping annual rent increases at three percent. In neighboring Montgomery County, lawmakers are considering two proposals that would cap rent increases at either three or eight percent. Have your popcorn ready.
• Los Angeles’ Measure ULA Tax: The ULA Tax is a new real property transfer tax that was recently approved by voters in Los Angeles. The tax went into effect on April 1st and will be levied in addition to existing city and county documentary transfer taxes. The ULA Tax will be 4% on all real property sales (commercial and residential, whether single- or multifamily) priced between $5 million and $10 million, and 5.5% on real property sales priced or valued at $10 million or greater. You do the math. It’s an extraordinary and very significant tax, which will very consequently impact the industry, reducing property values, transaction volumes, and ultimately, the economics and construction of new housing.
In addition, it’s inherently absurd, as it ignores the amount of equity one might have in a home, as it is based solely on the sales price. Therefore, someone selling a $4.5 million piece of property pays no tax, even if the property has no debt, while someone selling a $5 million asset with a $4.5 million mortgage pays the full tax. Finally, while the revenue raised by the new tax is intended to be used to fund affordable housing and tenant assistance programs, I assume it will make nary a dent on homelessness or housing affordability.
And, as always, there are always other interesting economic, financial, and real estate related tidbits that grab my attention
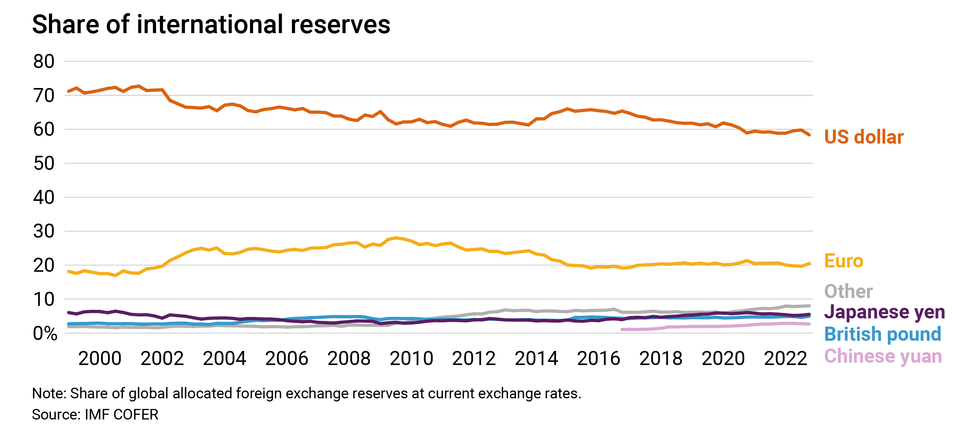
• Rumors of the U.S. dollars demise are greatly exaggerated. Every now and then, a story or three emerges about how this country or that one seeks to diversify away from the U.S. dollar, kicking off frenzied concerns about the inevitable end of dollar dominance. Naturally, these stories provide fertile ground for gold bulls, cryptocurrency promoters, and perhaps just your regular run-of-the-mill grifters to stoke fear about the dollar’s imminent (or just ultimate) death and the potentially catastrophic economic consequences that may follow. Lately, and not surprisingly, perhaps, given the political climate and ability to stoke fear via social media, there have been more than a few such headlines:

Doomsayers offer numerous reasons for the dollar’s inevitable demise, from China’s increasing local and global influence, America’s stagnant economic growth, chronic fiscal deficits, irresponsible monetary expansion and growing debt burden, trade disputes, etc., to challenges posed by potentially disruptive technologies like central bank digital and cryptocurrencies. However, it is my strong view that such rumors are just that, rumors, and that the dollar remains incontrovertibly dominant in global trade and finance, now and looking forward, if not a bit less dominant than before, perhaps Lebron James in the twilight years of his career.
Specifically, while the dollar’s share of central banks’ $12 trillion foreign exchange reserves has declined since 1999, it is still almost twice that of the euro, yen, pound, and yuan combined and the same as it was a decade ago. Its nearest competitor, the euro, accounts for barely 20% of central bank reserves (compared to the dollar’s 58%), followed by the Japanese yen and Chinese yuan at 5% and 3%, respectively.
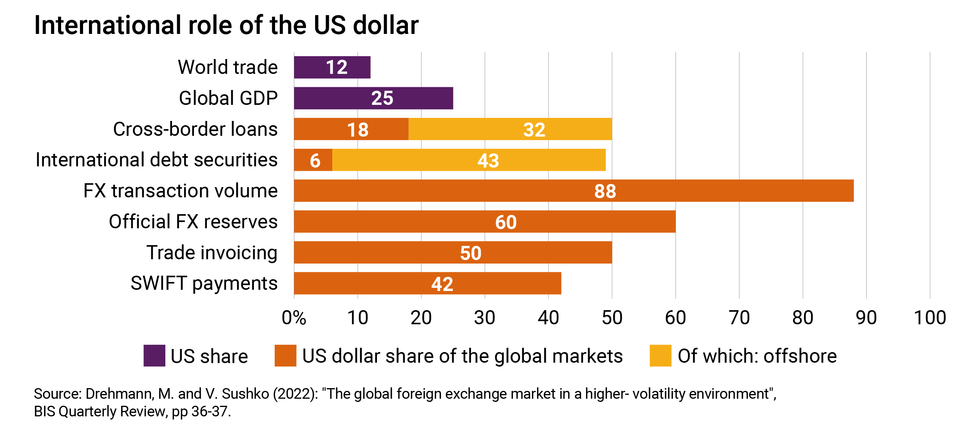
Moreover, China also employes strict capital controls and foreign investment quotas, as well as a complex system that manages onshore trading and influences offshore yuan activity, so until and unless such controls and heavy-handed management end, I cannot see the yuan replacing the U.S. Dollar anytime soon.
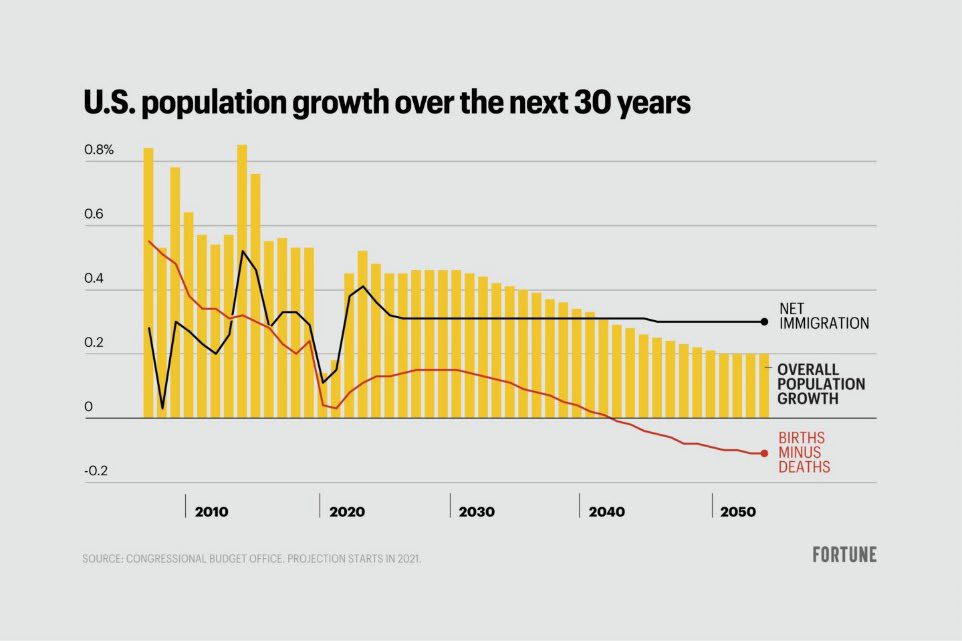
• While the exodus from big cities slowed in 2022, the U.S. population is expected to decline shortly after 2040 if current trends hold: In recent years, I have written extensively about demographic changes and how they might impact real estate markets looking forward. Broadly speaking there have been a few significant shifts in U.S. demographics.
One, folks are getting married later, if at all, and having fewer children. That is a persistent trend throughout the developed world, largely deflationary, and arguably irreversible no matter what incentives might be provided. Let’s face it, feeding, housing, clothing, and educating kids has gotten too darn expensive, especially in populated cities. And without a significant shift in immigration policy, projections indicate that the U.S. population will begin to decline in about 20 years, just like Japan, and more recently, China.
The second was a significant move back to urban cores beginning about 10 to 15 years ago, following decades of “white flight.” However, this trend reversed course again as a result of Covid, when people relocated to less dense suburbs and/or were able to work remotely and moved, if just temporarily. The third has been the relocation of households from the coasts to less expensive inland markets, resulting in the Californication (or NewYorkification) of several cities, from Phoenix to Atlanta, from Reno to Nashville, from Boise to Miami. In fact, California saw some 700,000 residents, net, leave the state following Covid, a figure matched only by New York, which experienced similar population outflows.
However, recent data suggests that the migratory outflows from the largest metro areas following the pandemic have abated, if not reversed course. However, New York, San Francisco, Los Angeles, Chicago, and Washington D.C. are still experiencing population declines, though they were far more modest in 2022 versus the 2020 to 2021 timeframe. But with greater remote work options and the obvious externalities of living in urban cores suburbs and exurbs should continue to witness greater relative growth than urban cores. In metro Atlanta, for example, Fulton County, representing the urban core, grew 1.1% last year, while four peripheral counties—Dawson, Jasper, Lamar and Walton—grew at least three times as fast.
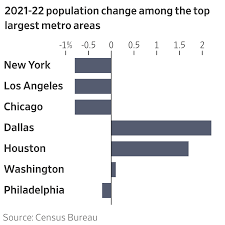
In conclusion, the first quarter of 2023 seemed to be the real-world embodiment of this year’s Oscar winner for best picture, Everything Everywhere All at Once, creating additional market and economic uncertainty
Making sense of economic and financial data and forecasting short-term trends is difficult in the most stable of markets, let alone volatile and uncertain markets like those we are experiencing today. The quasi-bank crisis we just witnessed in March merely adds to all the other uncertainties and unknowns we face, from inflation, the related Fed response in terms of the Fed Funds and Quantitative Tightening (or Easing, I suppose), Russia/Ukraine, China/Taiwan, the political environment, and even the impact of ChatGPT and artificial intelligence on just about everything. Perhaps in coming quarters, I will merely ask ChatGPT to write these memos for me. That sure would be a time-saver.
Meanwhile, we are fully aware of the challenges that lie ahead, and we are prepared to address them. For the existing portfolio, that means maximizing occupancy, managing expenses, carefully evaluating capital investment projects, and refinancing debt when possible, especially certain floating-rate debt we have on several of our more recent projects. We know that eliminating distributions, even for just a short while is painful, especially for me and the firm’s principals, given the significant capital we have invested in each and every one of the firm’s projects. But in uncertain times, conservative fiscal management must take precedence. And I remain convinced that the long-term outlook for the multifamily remains bright.
On the other hand, while markets remain challenging, attractive acquisition opportunities await, and we have been fortunate to find several. One is Aspire Seneca, in Victorville, California, a market we know well as we already own two assets in the submarket, including one right across the street. We have also acquired several other assets from this particular seller over the years. The projected returns are higher than we have seen in sometime, and we are still raising capital for that transaction. The other, an attractive three-asset portfolio in the Inland Empire, will be acquired using 1031 funds from two assets we successfully monetized (Aspire Midtown and Aspire Glendale).
With that, the entire Clear Capital team and I pass along our very best wishes to you and yours. We thank you for your continued engagement and support of our firm and its endeavors. And, as always, I want to express a special round of thanks to the Clear Capital Team, who continue to go above and beyond for our clients, colleagues, and partners, especially in challenging times.
Best,

Eric Sussman
Managing Partner
“Microeconomics concerns things that economists are specifically wrong about, while macroeconomics concerns things economists are wrong about generally.”
-P.J. O’Rourke
“Bull markets are a hell of a lot more fun.”
-Anonymous Managing Director, Merrill Lynch
According to Wikipedia, where I learn everything worth knowing (sorry ESPN, Twitter, and Truth Social), I have recently come to understand that New Year’s resolutions originated over 4,000 years ago in ancient Babylon during a 12-day festival known as Akitu. The tradition was subsequently adopted by the Roman Empire and then by knights in the Middle Ages, who would renew their vows to chivalry at the start of any year. Meantime, I know many of you are intimately familiar with Rosh Hashanah, signifying the Jewish New Year, which in on-brand messaging, marks the holiday with ten days of repentance, culminating with Yom Kippur, a day of fasting and prayers of atonement for past year’s transgressions.
Therefore, I wish to start the inaugural 2023 quarterly newsletter with more than just a perfunctory “Happy New Year” and expression of well wishes for 2023 (which I want to pass along, of course), but with a sincere mea culpa for getting the 2022 inflation and interest rate story so wrong. While I expected inflation and interest rates to increase under less accommodative Federal policies and that wages and rents would roughly keep pace, providing a reasonably inflationary hedge, I certainly did not expect the Fed Funds rate to rocket from 0.00 to 0.25% at the start of 2022 to 4.25-4.50% by the end of the year, following an unprecedented seven rate hikes in a single year.
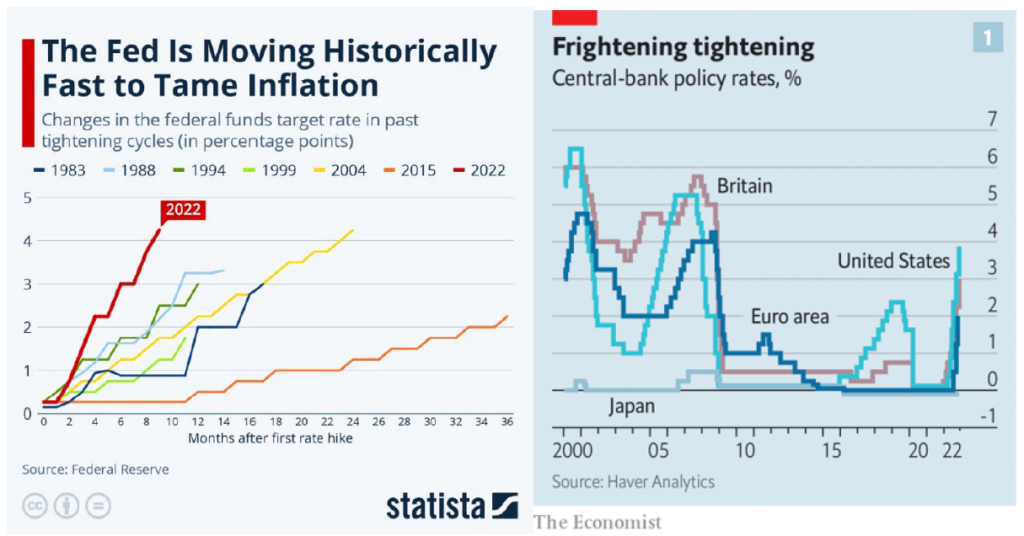
As a result, there was and is simply no way that wages, rents, and ultimately, the operating cash flows for virtually any asset (e.g., equities, fixed income, and residential/commercial real estate) could keep up with such a sudden increase in the cost of debt, especially since we (and others) so often use variable-rate debt in concert with value-add strategies. Even though that debt is hedged via interest- rate caps, rates moved up so sharply and quickly that we are now paying the maximum hedged interest rate on virtually all of our floating-rate debt. The pain is not inconsequential.
One silverlining is that lenders are requiring us to set aside funds each month to purchase replacement rate caps if we continue to hold the current loan subsequent to expiration of the rate cap. We are looking to utilize more fixed rate agency or bank financing while maintaining exit flexibility in future offerings.
Perhaps there is safety or comfort in numbers, as every single economist surveyed by the Wall Street Journal at the end of 2022 got it wrong, but such sentiments represent mixed emotions at best.
According to “professional” economists (an oxymoron if one ever existed) surveyed in late 2021, the average forecast for yields on 10-year Treasuries at the end of 2022 was 2.04%, with the largest outlier being 2.90%. Oops. 10-year Treasury yields actually finished the year at 3.78%, after peaking at 4.34% in October.
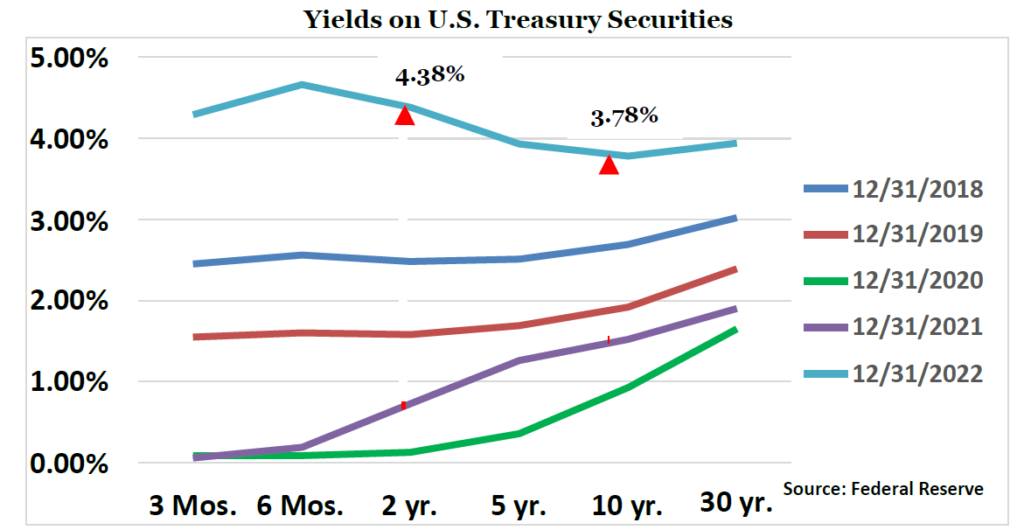
Meanwhile, the yield curve was substantially inverted at year end, with rates on two-year Treasuries exceeding that of ten-year securities by 60 basis points. Imagine that. Those supposedly “in the know” predicted that 10-year Treasury yields would end 2022 at 2.04%, while yields on two-year bonds ended the year at 4.38%. There is no other way to say it than that is one heck of a whiff. If there is a silver lining to the inversion, the market clearly expects inflation to subside, though it may be on the back of a recession.
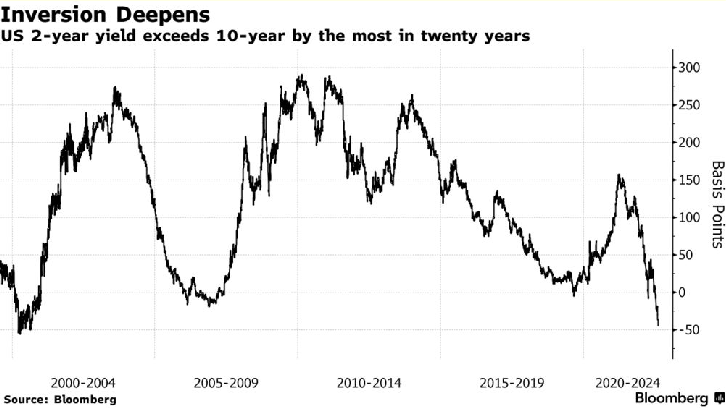
The last time prognosticators got it this wrong, Buster Douglas was a 42-1 underdog against Mike Tyson, the Soviets were merely slight favorites to beat a terribly overmatched U.S. men’s hockey team in the 1980 Olympics, the “Red Wave” in the midterm elections was expected to materially change the political landscape, and TCU had a fighting chance in this year’s college football championship game. As I have opined many times, prognosticating is one tricky endeavor. I suppose I should not be too harsh on myself. At least I didn’t put Elizabeth Holmes, Sam Bankman-Fried, Barry Minkow, or Ken Lay on the cover of a national publication or anything, believing they were the next Steve Jobs or Warren Buffett, or that Enron was the best company to work for. Yikes.

And the culprit for the unprecedented interest rate moves? Well, it’s simply this graph, setting forth monthly inflation rates (CPI-U) in the U.S. between the start of 2020 and the end of 2022. The good news is that inflation appears to have peaked and inflation rates have started to drop, declining each month since the middle of last year. What happens to this graph is quite likely the single most impactful unknown as we look forward to the financial and real estate markets in 2023 and beyond. Despite my misgivings, I will provide my inflation outlook in short order and will do so, knowing full well I might end up yet again with a face full of eggs. And given the recent price of eggs, that would be costly.
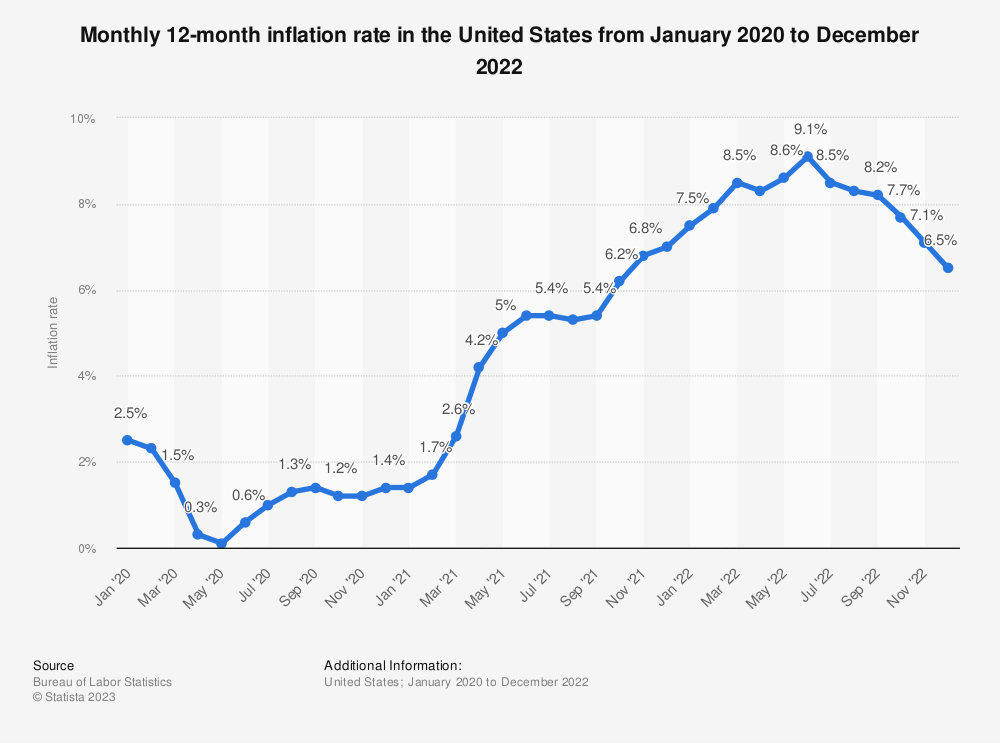
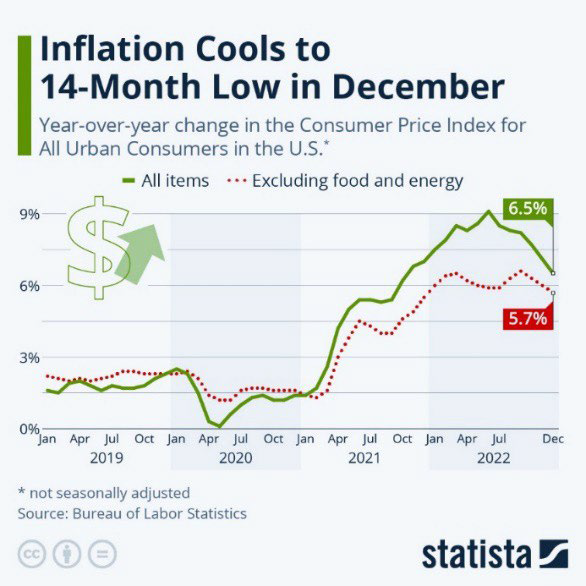
In response to inflationary pressures and the Fed’s aggressive responses, 30-year fixed rate, single- family mortgage rates more than doubled last year, from 3.05% at the end of 2021, to 6.42% at the end of 2022. Keep in mind that mortgage rates were even higher just a few months ago, reaching a peak of 7.2% in October, so as inflation has dropped since the summer, so have mortgage rates.
Needless to say, rates on multifamily and other commercial real estate debt moved up similarly, as have spreads, the margin over underlying indices that lenders use to “price” loans and the cost of debt. Higher rates and higher spreads are one of those double-whammies and, though I am not entirely sure what a whammy is, I know that even a single one is not good.
The result? Ugliness wherever one looks, as stocks recorded their fourth lowest annual return in half a century, with the S&P 500 down nearly 20% and the tech-heavy Nasdaq down by nearly a third.
For the first time in 150 years, both U.S. stocks and long-terms bonds were down more than 10%. During the fourth quarter stocks seemed to be stabilizing in October and November…and then came December. The S&P 500 and NASDAQ were down nearly 6% and 9% alone in December, after positive returns in the prior two months to start the fourth quarter. So much for a Santa rally.
Apparently, Rudolph and team went on strike, or his nose ran out of batteries.
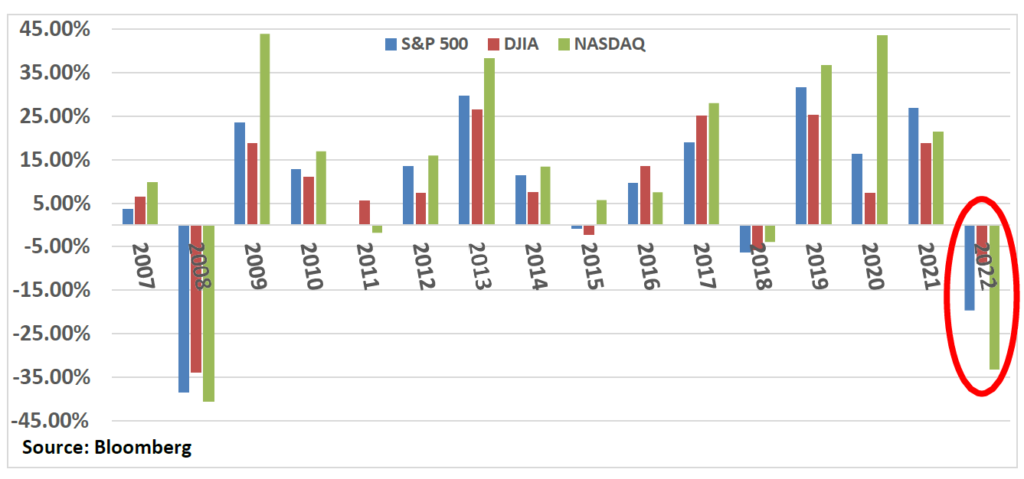
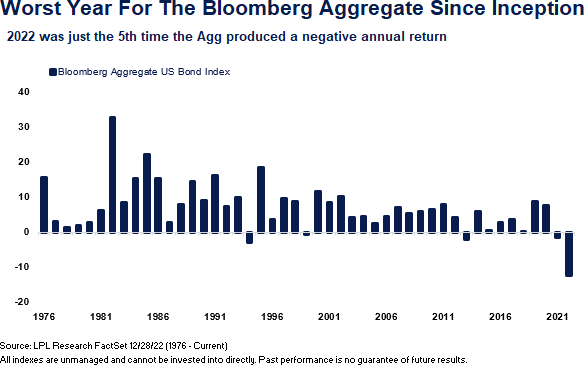
To nobody’s surprise, the stocks that have taken the most significant body blows are the previous highflyers, the ones which rarely, if ever, reported profits or generated positive cash flows, and whose entire business models remain suspect (e.g., Peloton, Roku, Affirm, Carvana, Coinbase, Spotify, Zoom). Indeed, the ones that Jim Cramer touted bigly with a routine “booyah,” when the cost of capital was near zero and investors seemed convinced that these firms would be long-term disruptors. Can I get another “oops”?
Regardless, the reality is that there was no place to hide in 2022, including real estate. The FTSE NAREIT Index, an index of publicly traded real estate investment trusts, was down roughly 23% in 2022. The best performing segment of publicly traded REITs was hospitality/lodging, down “only” 15.3%. Keep in mind that hotels can change rental rates daily in response to inflationary pressures
and travel significantly rebounded last year. Meanwhile, residential REIT prices were down 31.3% in 2022 and according to Green Street Advisors, commercial property prices overall (public and private markets) fell 13%.
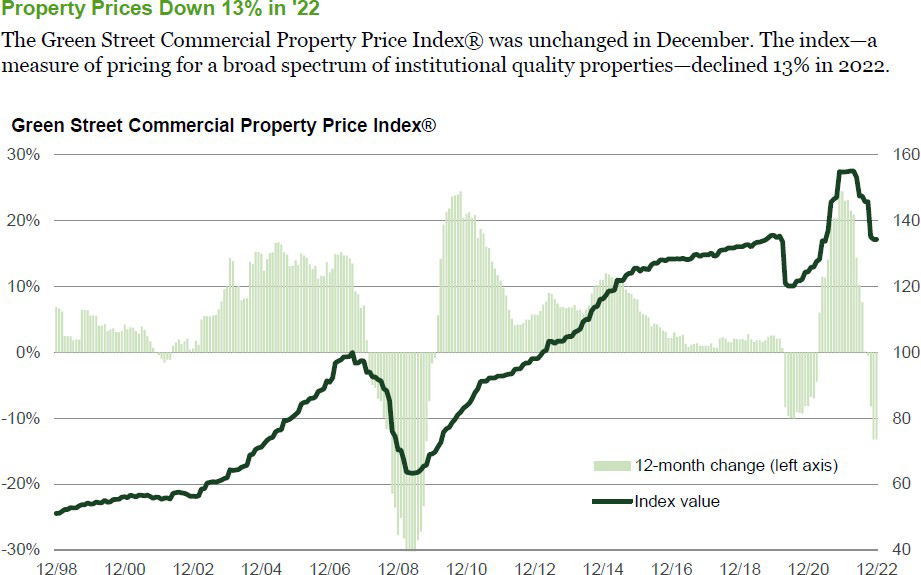
More granular results were fairly predictable. Existing home sales tumbled, down over 35% through November (year over year), while home prices themselves were down only modestly, about 5% on average, across various swaths of the country and different price points. This was one prediction I got mostly right, that higher interest rates would significantly reduce transaction volumes, but pent-up demand, persistent undersupply, elevated money supply and liquidity, the relative health of banks, the availability of mortgage capital, and continued (albeit lower) institutional investor interest in the space, would prevent what would be the worst sequel in history, the Great Financial Crisis, Part II (barely beating out Caddyshack II and Jaws: The Revenge).
Here is the data (through November) in all its…splendor:
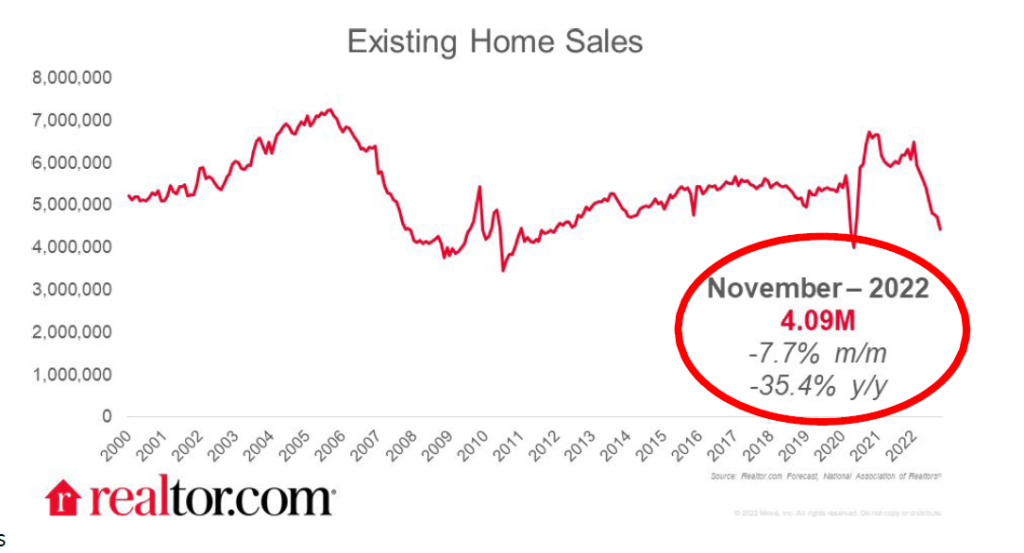
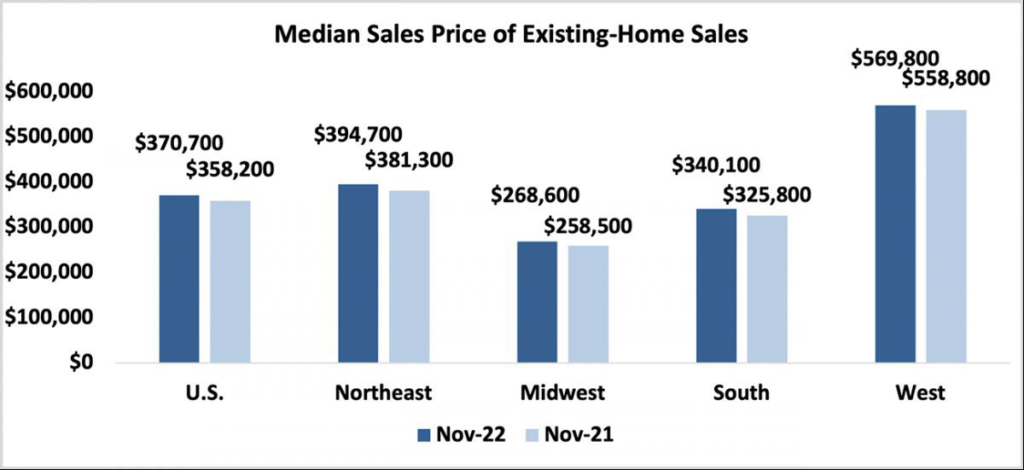
And the multifamily market? Was it able to buck the trend?
In a word, “no.” While multifamily assets should and generally do perform better in inflationary environments than other real estate assets encumbered with longer-term leases and stickier short- term cash flows, residential rents (like all rents) simply could not keep pace with the Federal Reserve’s gravity-defying interest rate moves. And to make matters more challenging, recession fears, general economic and political uncertainty, and the additional supply of units to several markets, have resulted in a recent softening of rents in most markets, a reversal of trends witnessed in recent years.
While I believe these challenges and headwinds are transitory and will provide some very favorable buying opportunities, they will create operational and financial challenges in the interim, as bear markets inevitably do. That is, the longer-term fundamentals supporting multifamily investments remain squarely intact (e.g., affordability, supply of single-family homes, demographics). However, if asset managers and private equity firms are prudent and conservative, they will likely reduce distributions, manage controllable expenses more carefully, and postpone capital projects with uncertain ROIs until inflation abates, markets stabilize, and visibility becomes less uncertain, likely during the latter part of 2023. We are certainly doing so and I was hardly surprised when Blackstone recently announced that it would “curb” investor withdrawals from its behemoth $69 billion REIT.
A few pictures communicate a thousand words with regards to the multifamily markets. While national rents increased 3.8% in 2022, the annual figure masks a more sobering reality that rents actually declined in each of the last four months of the year. For example, rents in December 2022 were down 0.8% nationally. The reality is that 2021’s overall multifamily rental growth of 17.6% was simply remarkable and unsustainable and so it is not shocking that rental growth in the 40 largest markets has softened during the past year.
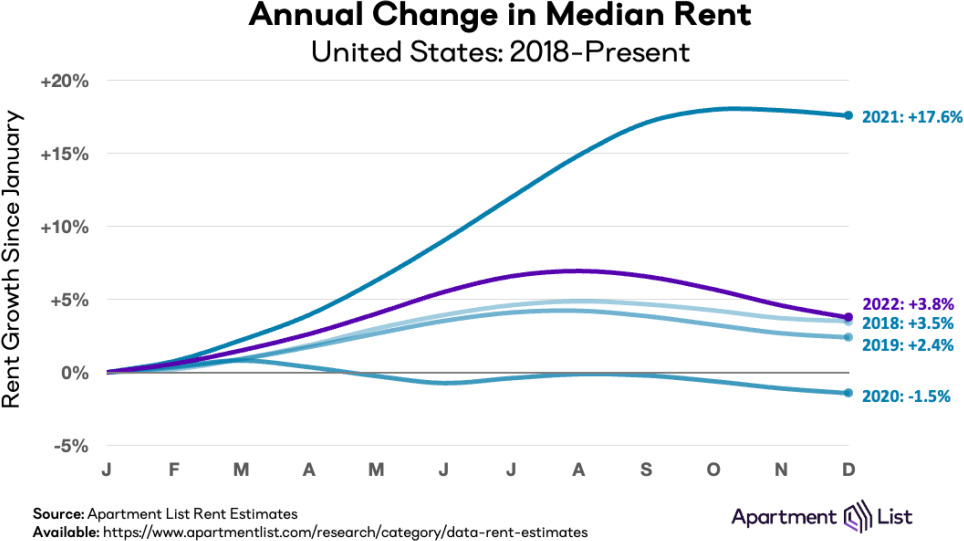
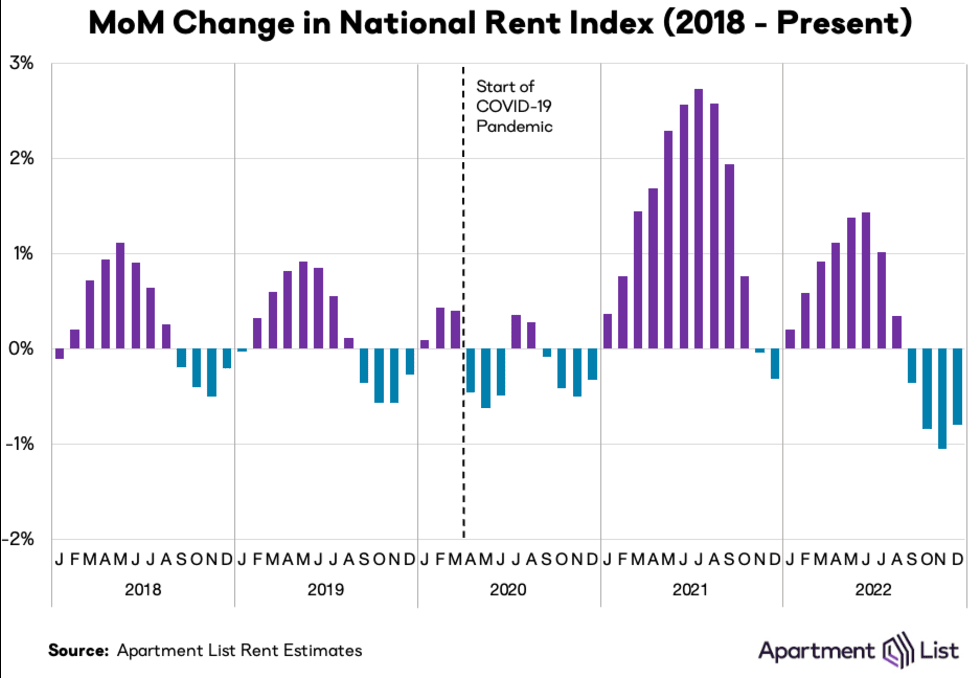
For example, in Palm Beach, rental growth declined from 30.4% in 2021 to 1.7% in 2022, still positive, but barely so. Phoenix and Las Vegas, markets that witnessed 20%+ rental growth in 2021, saw rents decline year-over-year. And 2022’s Oscar winner for “greatest year-over-year rental growth?” Indianapolis, at 7.4%, followed by a number of other Midwestern markets, including hotspots Cincinnati, St. Louis, and Columbus. Last year’s top 10 list for rental growth was over- represented by cities in the Midwest, after the Southwest and Sunbelt were overrepresented in prior years. Is it “what goes up, must come down” or “what does not go up as much as others, must eventually catch up?”
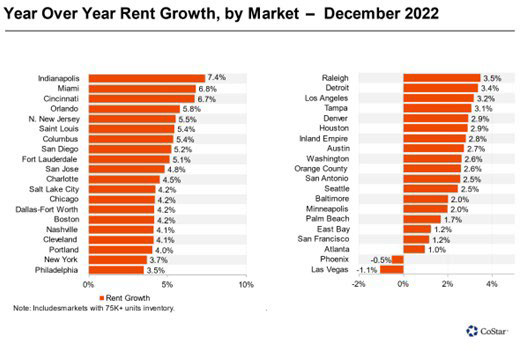
In short, the fourth quarter was a challenging one for multifamily investors and asset managers, on top of an otherwise challenging year of inflation and higher capital costs, as limited absorption (net units rented) and new demand ran headfirst into the reality of nearly 100,000 new units delivered to the market nationally, increasing the national vacancy rate from 5.7% at the end of the third quarter to 5.9% at the end of 2022. And I am not even counting the housing that Elon Musk created when he converted some of Twitter’s offices into temporary bedrooms, causing some to quip that Musk is the first person to add housing to the Bay Area in years.
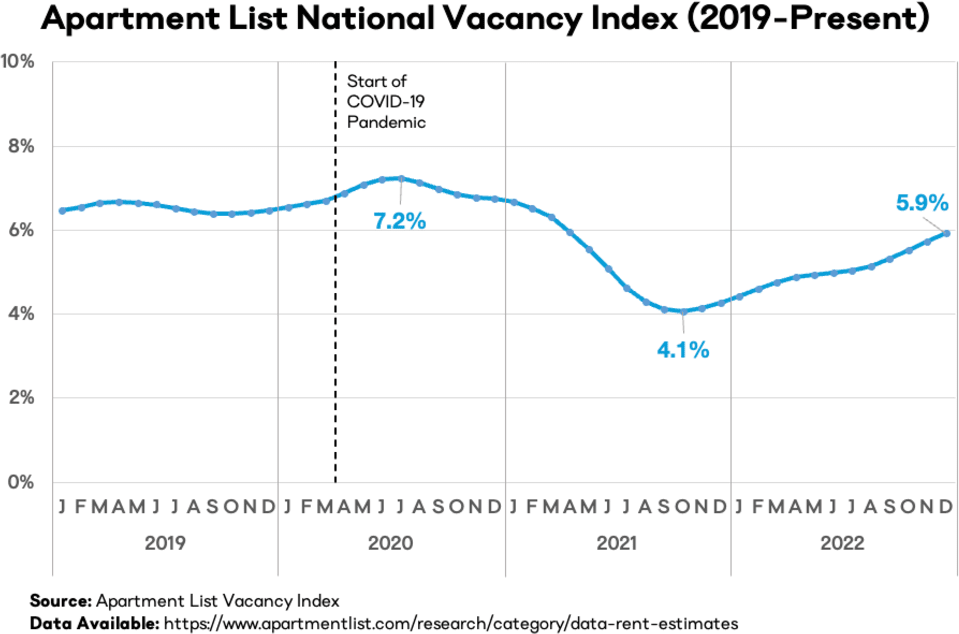
In short, 2022 was already likely to be challenging, if just by comparison to 2021, before Russia – in what has to be considered an extraordinary and historic strategic blunder – invaded Ukraine and China decided it would be better off shutting down its economy to stymy Covid rather than treat its population with western vaccines. Throw in a spoonful of financial fraud (FTX/Alameda Research) and a pinch of domestic political chaos (heck, I was willing to become Speaker of the House last week) to a gallon of inflation and Federal Reserve tightening, and you have a Michelin-starred recipe for a bear market and significant declines in asset values. 2022 was truly the flip side of 2021, where almost any investment strategy worked, and all asset classes saw healthy returns. Markets can indeed be and are fickle things.
So, what’s the broad economic outlook for 2023? Will market values recover? Inflation and the Fed? Recession or…?
One might think that being once bitten, I would be twice or perhaps three times shy in making predictions for 2023, but old habits die hard, I suppose. Maybe I am just like that proverbial broken watch, right twice a day. I am also an optimist by nature, believing that market downturns inevitably create opportunity for longer-term, patient investors, perhaps because they do.
To cut to the chase, I expect 2023 to be a year when the markets find their footing and, during the second half of the year, recapture all of 2022’s losses, perhaps a recurrence of what happened in 2009 following 2008’s significant market declines. Inflation will continue to retreat as the economy softens and the impact of higher interest rates and capital costs take their toll. The markets will respond favorably to lower inflation prints and the end of the Fed battering ram. Residential and commercial real estate rents will decline across nearly all markets during the first third or half of the year, before recovering, repeating what we witnessed during and subsequent to the Great Financial Crisis and other downturns over the past couple of decades.
While a 2023 recession seems a real possibility, I am not convinced that one is unequivocally in the cards. For one thing, according to a recent survey of public company CEOs, over 90% felt that there would be a recession this year. I am not nearly convinced that CEOs are more accurate at forecasting than professional economists, though one would expect that they would have better information and insights as to current demand and backlog. The contrarian in me tells me that when there is that sort of consensus, something else is likely to happen. Secondly, global GDP was up 1.3% through the third quarter of 2022, and while these numbers are nothing to crow about, they are not horrible given all the headwinds the world economy has faced and they do show growth, albeit modest.
In addition, while layoffs have accelerated of late, unemployment remains low and the job market fairly robust, even in the face of higher inflation and a broader economic slowdown. While tech firms are laying off increasing numbers of staff, Main Street is acting as a job sponge and is still facing challenges attracting and retaining talent. Job losses at Amazon, Twitter, Meta, Microsoft, and Salesforce have thus far been offset by employment gains in leisure/hospitality, healthcare, and other service industries. In December, employers added 223,000 jobs, above the 200,000 estimates, though these results represent the smallest job gains in two years. Average hourly earnings were up 4.6% year over year, down from March’s peak of 5.6%, and below more inflationary expectations (5%). The wage gains were the most modest since mid-2021.
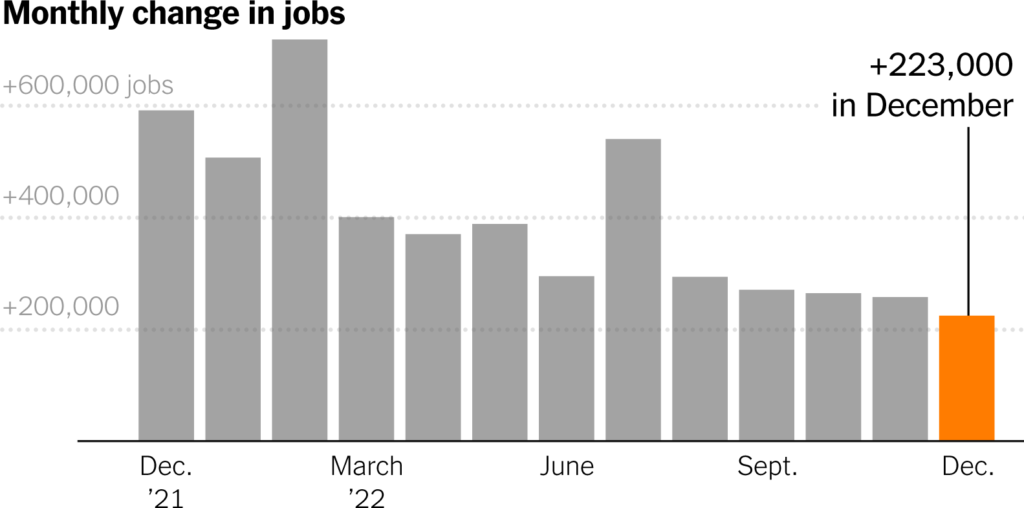
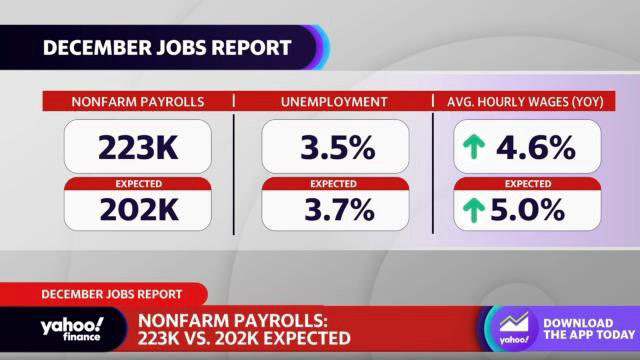
Some articles have announced the tech layoffs with attention-grabbing headlines, as though these headcount reductions represent the “end” of an era in Big Tech, as the Washington Post crowed in mid-November, with a tagline that the layoffs are “stoking memories of the dot-com crash 20 years ago.” Please. Nothing like a dash of journalistic hyperbole to accompany your morning latte. Sure, Amazon, Meta, Microsoft, Netflix, Alphabet, Twitter, and Apple are trimming some fat, but they aren’t going anywhere and future technological breakthroughs in everything from virtual reality to artificial intelligence to health care will prove significant future job creators.
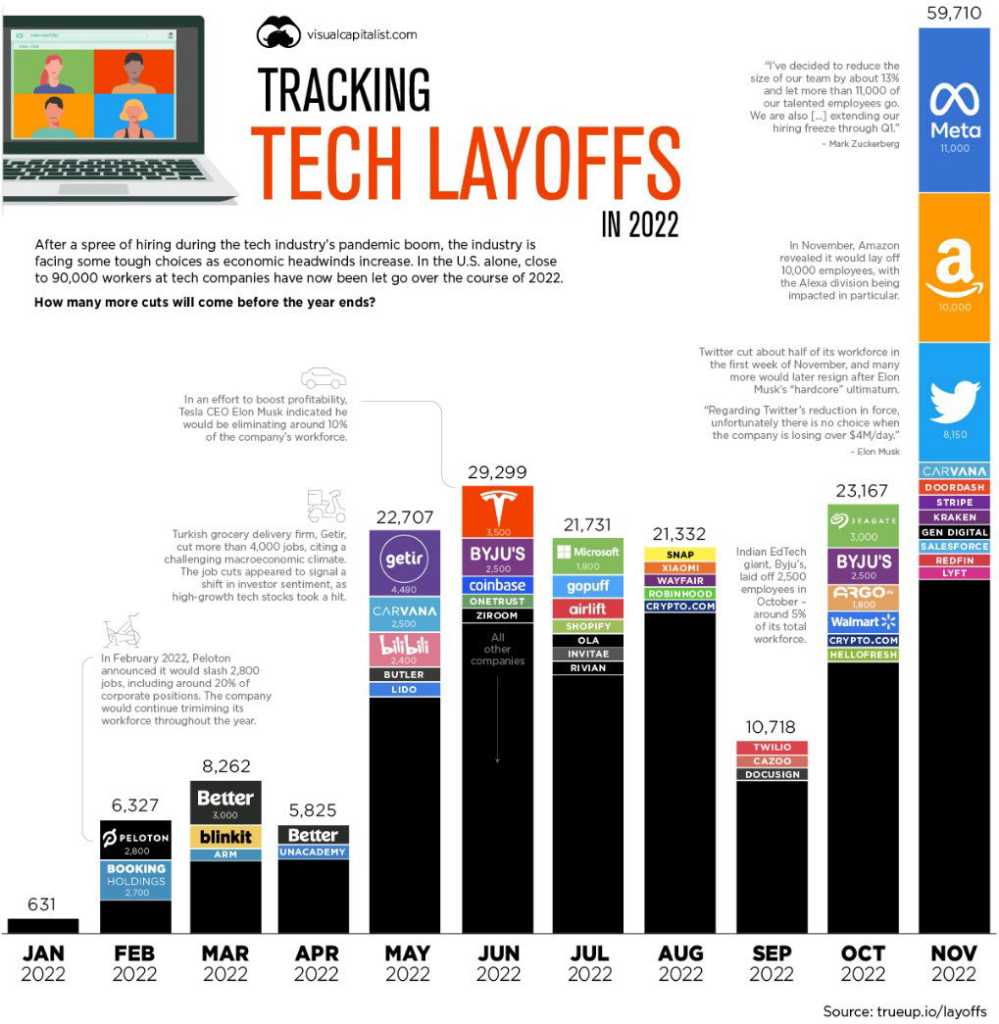
Meantime, consumer confidence has rebounded off its summer lows, as have the equity and bond markets. In fact, the S&P 500 and NASDAQ are up 4.2 and 5.9%, respectively, during just the first two weeks of 2023. And in one last data point, the staff tending the front desk of the spa at the ARIA casino in Las Vegas told me they were swamped and completely booked when I asked just a few weeks ago during a visit and was on my way to the gym. Thus, consumers are clearly still spending on discretionary items, at least when it comes to shiatsu and aromatherapy, according to the SSBI (Sussman Spa Bookings Index™).

However, we should keep in mind that residential and commercial real estate comprises some 20% of U.S. GDP. Housing’s combined contribution generally averages between 15 and 18% of our economy and includes construction of new single-family homes (including manufactured ones) and multifamily projects, residential remodels, and brokerage commissions. Perhaps it is as simple as one of my UCLA Anderson colleagues, Ed Leamer, wrote in a 2007 paper, “the housing cycle is the business cycle.” Meanwhile, according to another study I recently read, commercial real estate (think office, retail, industrial) contributes another five percent to our GDP each year.
In short, one does not need to be a psychic, economist (professional or merely rank amateur), market pundit or guru to recognize that sharp declines in residential and real estate transactions and declines in new housing starts and permits issued will translate to significant economic drags in 2023 and perhaps beyond. In addition, in my last quarterly update, I predicted that declines in the housing market – purchases and sales and housing starts – would present considerable headwinds to companies whose results are closely tied to the housing cycle. The recent rumor that Bed, Bath, & Beyond will be shortly filing for bankruptcy could be Exhibit A in this regard. I expect other firms to follow or significantly underperform (e.g., Wayfair, Williams Sonoma). This simple chart speaks volumes, indicating that housing starts are expected to decline sharply in 2023, regardless of who is doing the forecasting.
The worst of inflation appears behind us (can I get a “hallelujah”?), but the question remains as to where it might find its equilibrium, and will that equilibrium approach the Fed’s two percent target? At this point, I see more deflationary pressures in the U.S. economy, though energy and food prices are challenging to predict. Between significant declines in nearly all asset values (e.g., equities, bonds, real estate), the recent retreat in crude oil prices (back below $80 a gallon from over $100 this past summer), December’s historic 15% decline in used car prices, and the overall 0.1% decline in December’s CPI-U from November, evidence of deflation is not hard to find.
In early December Kroger’s CEO indicated that food inflation was “easing” and in fact, food prices declined modestly in December, down 1.9%, according to the FAO Food Price Index, while overall food prices were up 10.4% last year. Of course, one might not believe the data based on the price of eggs, where not just the sunny side is up. Egg prices were up 60% in 2022 and over 11% in December alone. Finally, in perhaps the most probative data point surrounding inflation, I recently read Sam’s Club recent earthshaking announcement that it has cut the price of its in-house hot dog and soda combo to $1.38 from $1.50, undercutting Costco! Of course, the last thing I need is additional motivation to consume more hot dogs.
Money supply and bank lending activity also provide compelling deflationary evidence
Over the past few quarters, I have mentioned that tremendous sideline liquidity – some $22 trillion in M2 money supply – provided a significant downside buffer to sustainable market declines and support for my contention that once markets stabilize and fears of recession abate (or a mild recession ends), that liquidity will find its way into the markets, driving prices back to previous levels. However, in recent months, there has been a modest decrease in money supply, consistent with deflationary pressures.
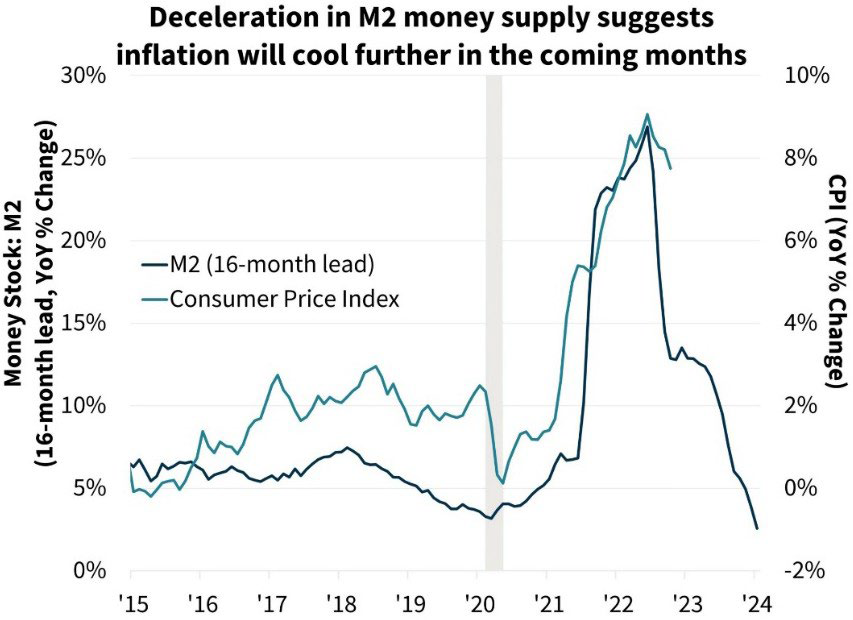
In addition, U.S. banks have tightened underwriting standards for business loans, consistent with what we are witnessing in multifamily real estate lender underwriting. Stingier loan underwriting is deflationary, at least on the margin.
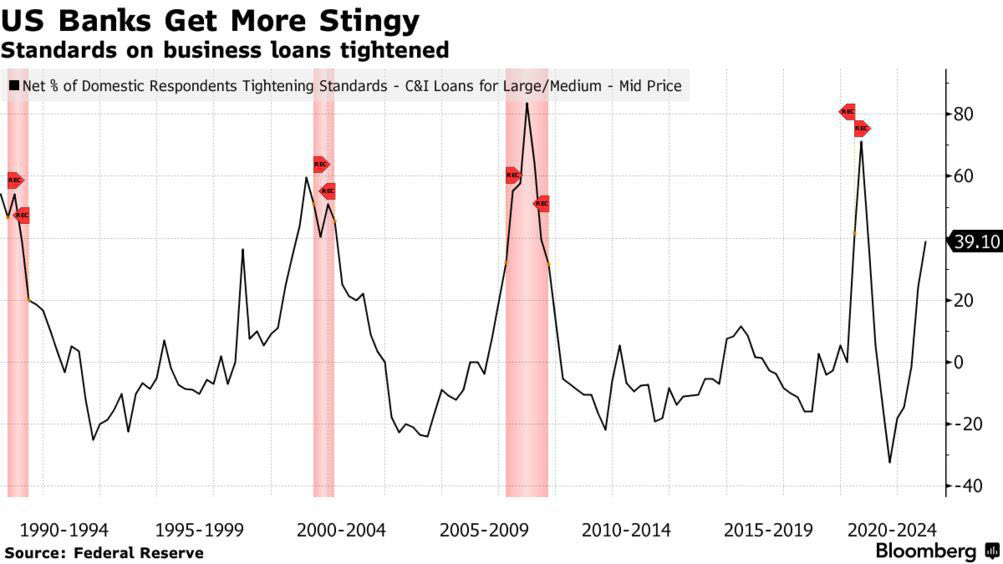
The unprecedented run we experienced in housing prices and rents between 2010 and the end of 2021 is clearly taking a pause. The days of multiple offers, many waiving contingencies, offering significant non-refundable deposits, and/or others accompanied by pictures of families and cute pets, are likely over, at least for this cycle. As mentioned, single-family home prices are generally down about 5% nationally, and according to a recent article I read, about 8% of homes bought in 2022 are under water. Certain markets, principally those that defied gravity in recent years (e.g., Boise, Phoenix, Atlanta, Austin) and witnessed prices of single-family homes rise nearly 60% or more between 2012 and 2019, are down more sharply.
For example, according to Redfin, housing prices in Austin and Boise declined by over 3% and 2% in December alone, respectively, and homes were taking over two months to sell, twice as long as last year. In another example, the median home price in Sacramento, where Clear Capital owns two assets, the median single-family home increased 40% in value between March of 2020 and the end of June 2020, reaching a median of $560K. More recently, the median home price has dropped to about $510K, a modest (10%) retracing.
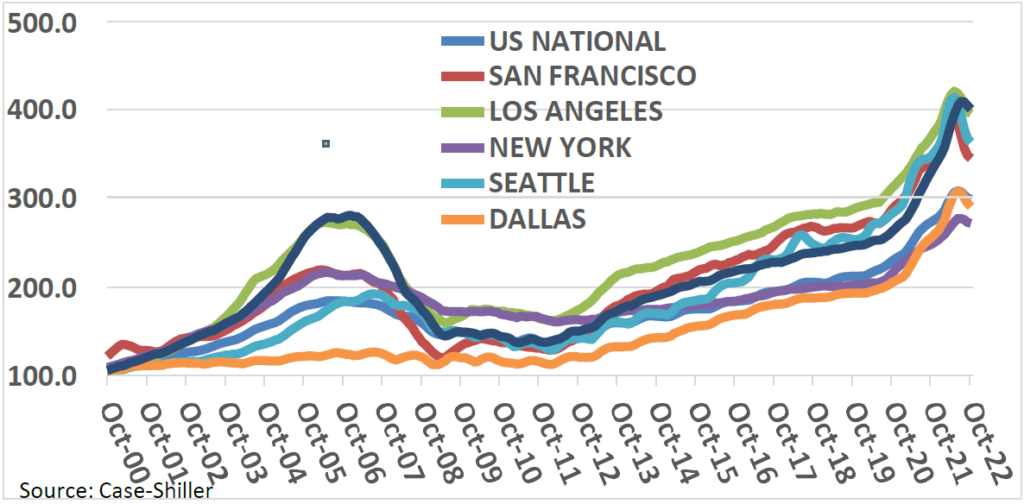
How long the housing slump lasts remains to be seen, but I anticipate that rents will decline modestly over the next year and then begin to rise again, recapturing previous highs, similar to what we witnessed during and subsequent to the Great Financial Crisis. Keep in mind that a new study released by National Multifamily Housing Council and National Apartment Association indicated that we need to build 4.3 million new apartment units by 2035, just to meet demand.
However, the data is conflicting. On the one hand, graphs like those below seem to indicate that housing prices may be poised for further declines, if just because they appear at significant odds with historical norms, whether comparing them to interest rate levels (first graph) or other factors including population growth (second). Both graphs are sourced from Robert Shiller, of Yale and Case-Shiller fame.
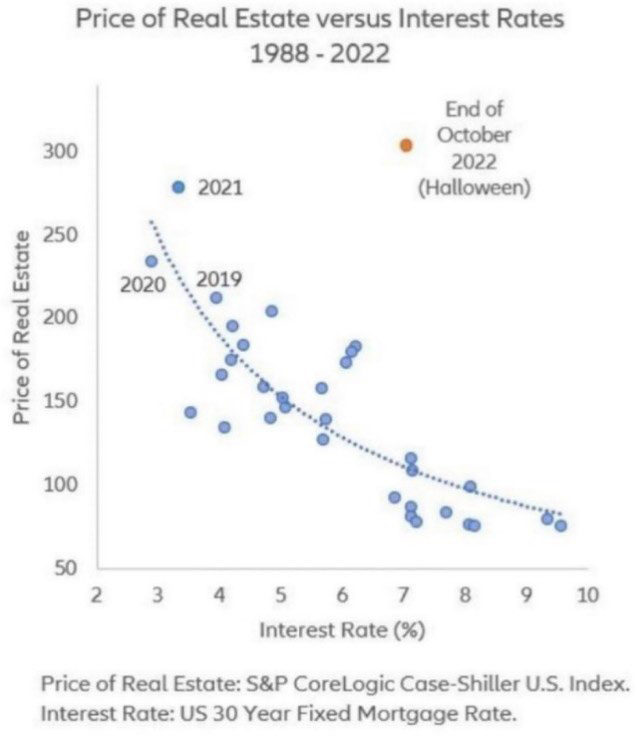
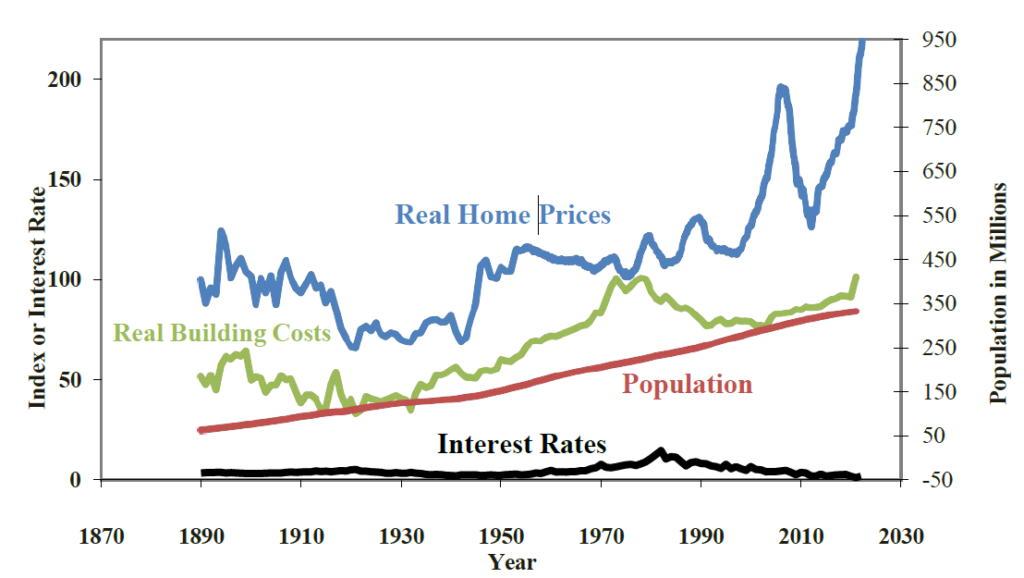
However, as discussed in previous memos, this time may, in fact, be different, as a result of everything from Covid and pent-up demand, a lack of single-family supply, institutional involvement in the single-family market, and excess liquidity. Moreover, three other important data points provide support for the contention that significant declines in housing prices are not in our future.
One, banks have exercised far greater underwriting discipline in recent years, such that more than half of borrowers have credit scores of over 760. Two, the collective amount of equity homeowners own in their homes exceeds $30 trillion, a record high, and a very different reality than what we witnessed during and following the Great Financial Crisis. Finally, as discussed in the last quarterly memo, banks are in decent financial shape and not excessively levered generally, with excessive exposure to the single-family market.
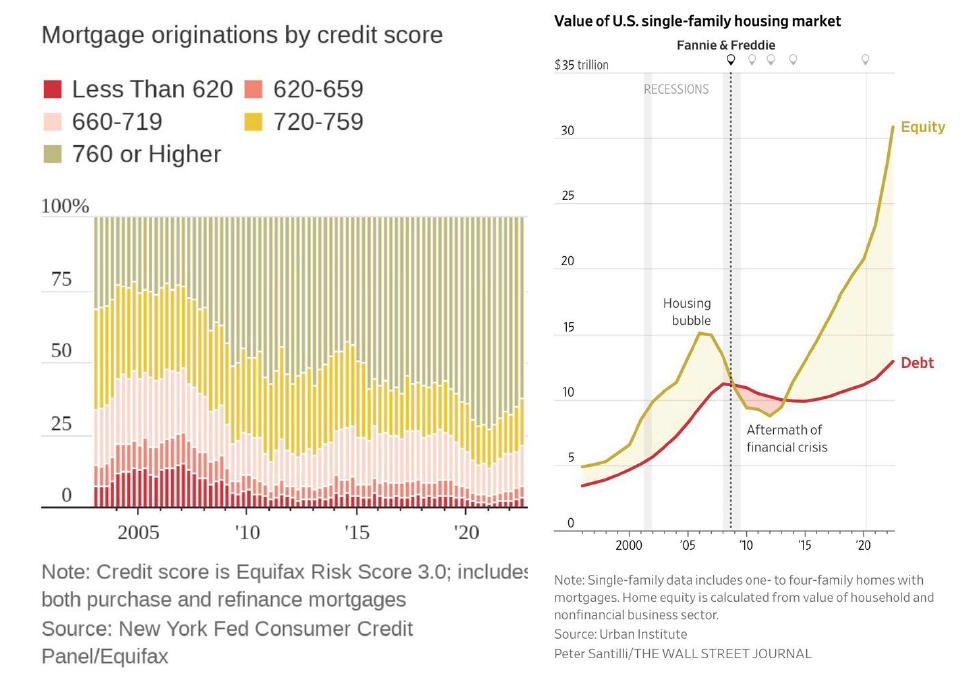
In short, I expect the housing market, both single- and multifamily, to be fairly soft in the first half of 2023, but to rebound towards the latter half of the year and into 2024, as inflation subsides, interest rates decline, the Fed ends its money-tightening endeavors, and the equity markets stabilize. In the meantime, macro-level themes persist. Single-family homes will remain out of affordable reach for many or even most, driving them to rent, perhaps indefinitely.
Consistent with that premise, I recently read an article in the Wall Street Journal about non-profits getting into the housing game, acquiring single-family homes for cash, and then re-selling them to families at cost, a sort of “activist home flipper.” The particular non-profit and market featured in the article were in Milwaukee, where home prices are far more affordable than countless other markets. But these efforts reveal just how widespread and systemic the housing affordability issue happens to be. However, while these efforts may merely reflect that old adage that “desperate times call for desperate measures,” I cannot fathom that they will be broadly impactful.
Meantime, I am keeping my eye on several other housing-related trends and data points
• Homebuyers are moving farther away: In an interesting statistic recently released by the National Association of Realtors, buyers who bought homes during the year ending June 2022 moved a median of 50 miles from where they owned their prior home, the greatest distance on record, literally quadrupling historical behavior, and reflecting an increasing trend over the last five years. Remote work and lower housing prices are compelling relocations and growth in tertiary and quaternary markets, exurbs, and rural markets, trends we have discussed at length previously. The shift explains the explosive growth in markets like Idaho and California’s Central Valley, from Riverside County to North Port, Florida, to Indianapolis. I am reminded of Southwest Airline’s catchy advertising tagline, “You are now free to move around the country.”
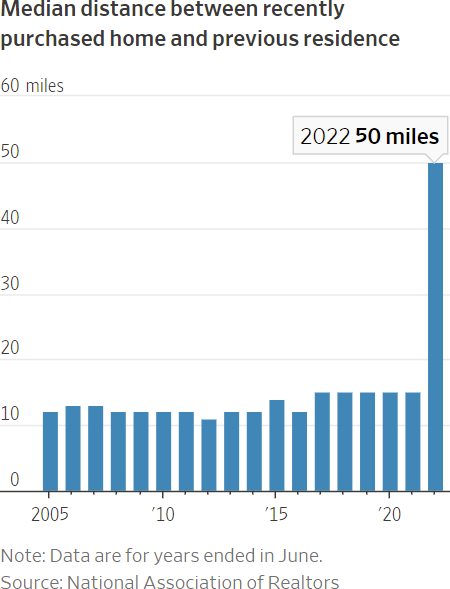
Home sales to investors slid 30% in 2022: In the third quarter of 2022, institutions bought approximately 66,000 houses in the 40 markets tracked by Redfin in Q3, down over 30% from the same period in 2021. Even institutional investors have been reining in their horns a bit in the face of all the economic, political, and market uncertainty. But let’s be clear. They have proven that owning single-family homes as rental units is an investable and scalable asset class for institutions, and I expect they will continue to scoop up homes, new and existing, going forward, competing with traditional homebuyers.
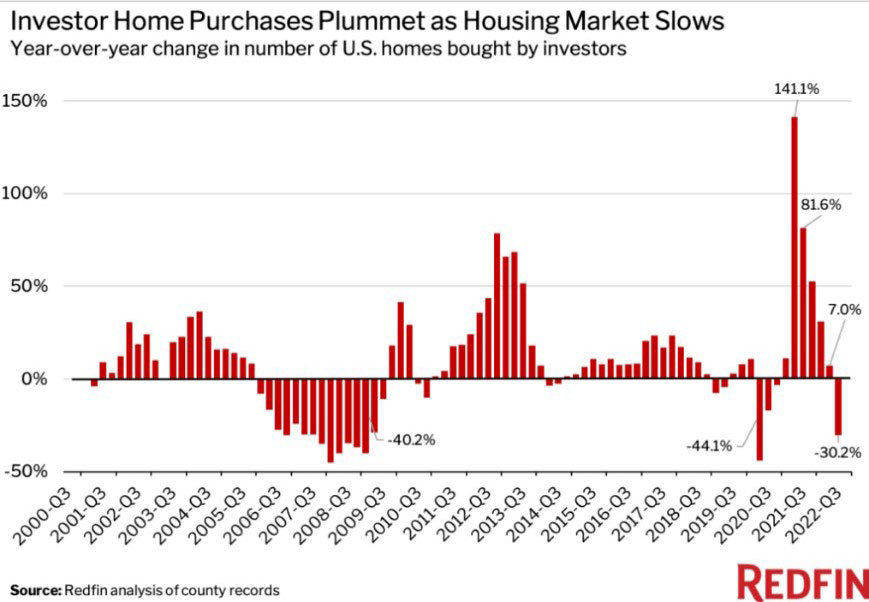
Millennials are much less likely to own their homes: In a data point surprising nobody, millennials are far more likely to be renters or living at home (sorry, parents), and I believe that this trend will persist for the foreseeable future, presenting additional long-term tailwinds to Clear Capital’s multifamily strategy, despite nearer-term challenges.
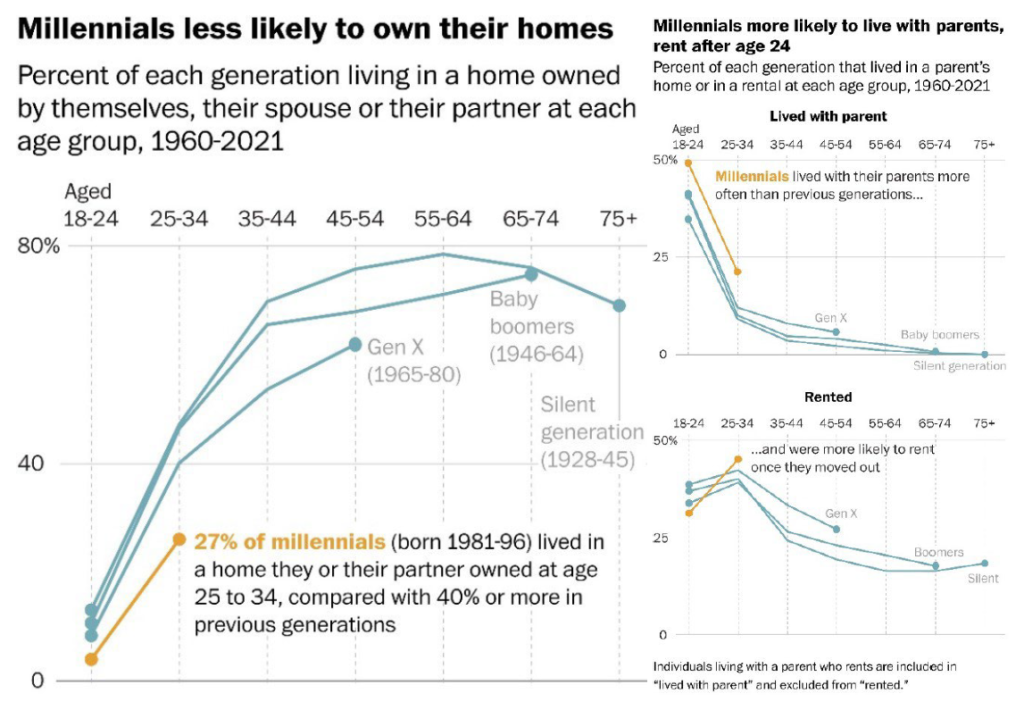
Uncle Sam will start backstopping mortgages of more than $1 million in “high- cost” markets beginning this year: In November, the Federal Housing Finance Agency announced that it will begin to back single-family residential mortgages up to $1 million in certain “high cost” parts of the country, allowing prospective homeowners to secure larger loans with lower rates. In most areas of the U.S., the new limit for “conforming” loans backed by Fannie Mae or Freddie Mac, will be $647,200 for single-family homes, an increase of nearly $100K from the previous limit of $548,250. I don’t think the change will be significantly impactful, but it is a worthwhile data point impacting the housing market.
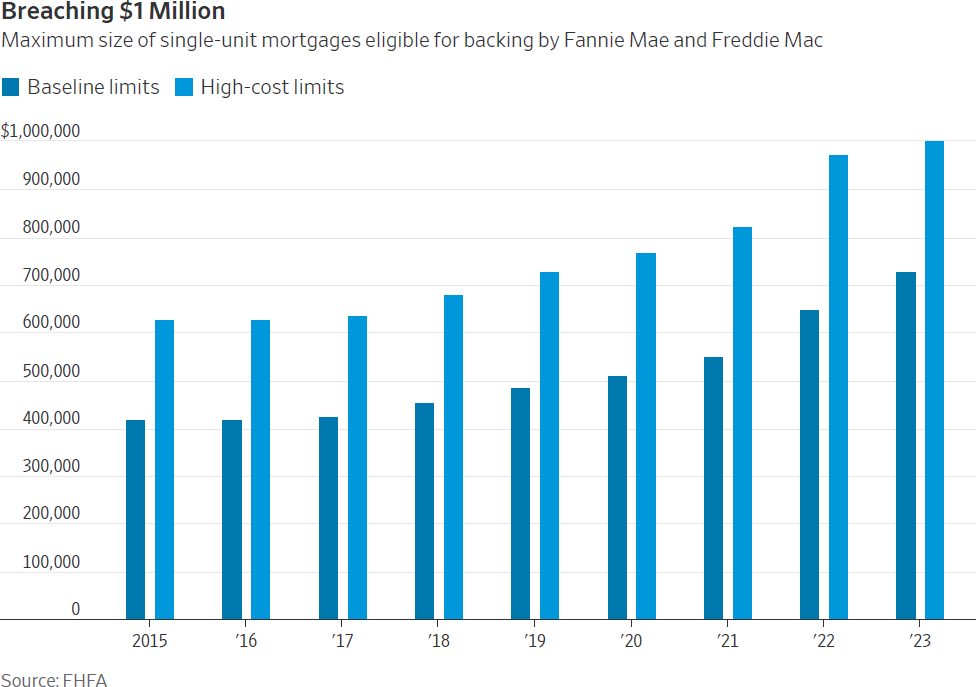
Foreign housing markets, however, are facing even greater pricing pressures, with several markets (e.g., Canada, New Zealand, Australia) experiencing double-digit price declines: Last week I was giving a presentation to a group of corporate real estate folks from Taco Bell, when someone from the audience asked for my views about Canadian real estate markets. I confessed that while I don’t follow them very closely, I had seen some data surrounding single-family homes that made me uneasy. Specifically, several of these foreign markets are far more levered, with far higher levels of household debt. Australia, Canada, and Sweden, in particular, appear at far greater risk than the U.S. or Ireland, for example.
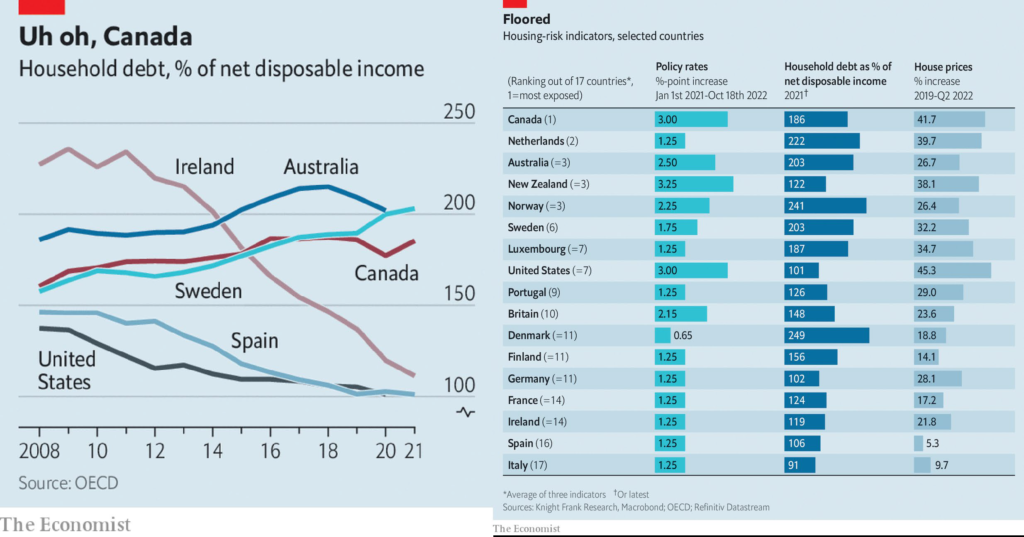
Finally, there are always a few other economic, political, or market headlines or news items that have grabbed my attention and are noteworthy
• Politicians mostly seem to have taken the fourth quarter off: In a welcome break, politicians and other policy makers were rather quiet during the fourth quarter of 2022, perhaps focusing on midterm elections, holiday shopping, and the third season of Emily in Paris. I did read one relevant article, however, which discussed how tax policies surrounding vacant land are creating an unnecessary impediment to the construction of new housing. Specifically, in certain areas (e.g., New York City), tax levies on high-rise housing projects are often higher than on vacant lots. The article focused on one six-acre site next to the United Nations on the upper east side, which is valued at over $100 million and is zoned for 1,500 apartment units but has sat empty for 15 years because taxes on the parcel are minimal. While I am dubious that property or other local taxes could present such a significant impediment to a potentially successful housing project, I have repeatedly spoken and written about how policy makers should focus on economic carrots and incentives to promote housing development and increased unit density.
• The office market is a dumpster fire: Many tech companies that drove demand for office space here and elsewhere as they expanded are now canceling leases and flooding businesses with office space as they downsize. Recently Meta, Lyft, Salesforce, and Twitter have been shedding millions of square feet in the Bay Area (Silicon Valley and San Francisco), New York, and Austin as they reduce headcount and shrink their office footprints. Amazon.com stopped construction in July on new office buildings. About 212 million square feet of sublease space is on the market, a record since CoStar began tracking such data in 2005. The national occupancy rate, about 12.5%, its highest level since 2011, will be heading higher in 2023 as net new absorption will be decidedly negative. I anticipate a large number of office foreclosures this year and next, and I would steer clear of the segment as I fail to see any upside catalysts.
• Mergers and acquisition volume, stock, and bond offerings, as well as angel and venture activity are at their lowest levels in a decade: As the equity and debt markets swoon, Wall Street and their brethren are taking a proverbial breather. IPOs, debt issuances, and venture capital deal volume will likely be taking an extended vacation in 2022, at least until interest rates and markets stabilize. This trend is not only deflationary but will impact virtually all real estate markets and asset classes.
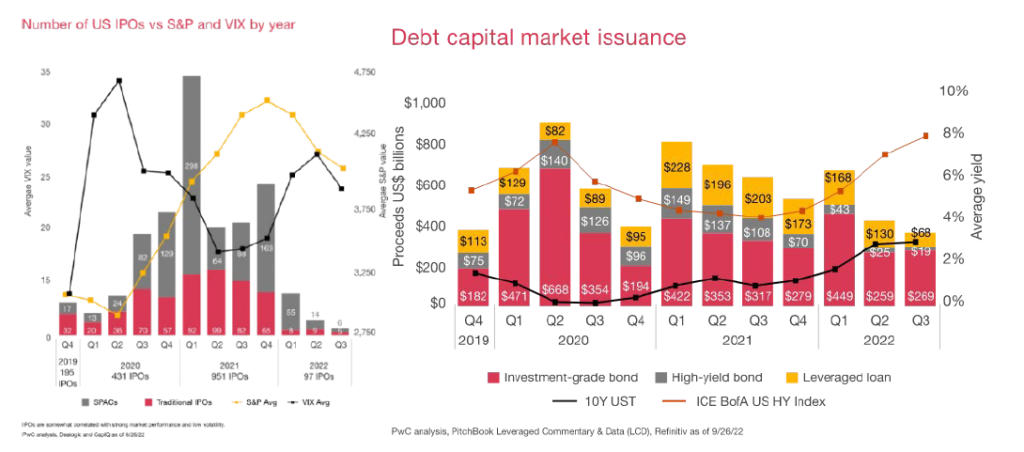
• Over the next thirty years, baby boomers will be transferring tremendous wealth (and real estate) to Generations X and Y: Over the next several decades, Generation X (born between 1965 and 1979/1980), which includes this author, and Generation Y (born 1984 to 1994-1996) are poised to inherit over $28 trillion from baby boomers, those born between the end of WWII and 1964. I can almost hear the long-gone John Houseman echoing a slight twist on that distinguishable catchphrase he popularized in Smith Barney commercials back in the 1980’s: “I make the money the old-fashioned way. I inherit it” (for you, youngins, Smith Barney “earned it.”). The impact of this wealth transfer will be significant, but uncertain. I assume many homes that have not been sold in decades will hit the market as beneficiaries monetize assets, those that they ironically may not be able to afford or even want to own and live in.
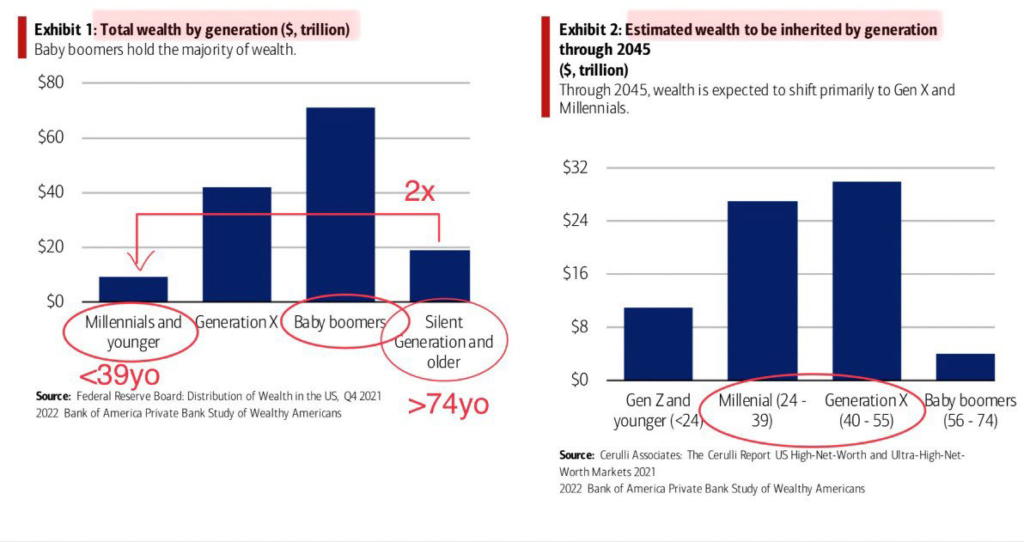
• And lastly, a couple of updates on demographic data and population shifts: During the last quarter, a few articles and data points crossed my desk regarding demographics and population, merely confirming trends we have noted and discussed for some time. One, U.S. population growth remains sluggish, increasing just 0.4% for the year ended June 30, 2022, somewhat better than the 0.1% increase during Covid. Eighteen states lost population, led by New York (-0.9%), Illinois (-0.8%), and California (-0.3%). Population gainers included Florida (1.9%), Idaho (0.8%), South Carolina (1.7%), and Texas (1.6%).
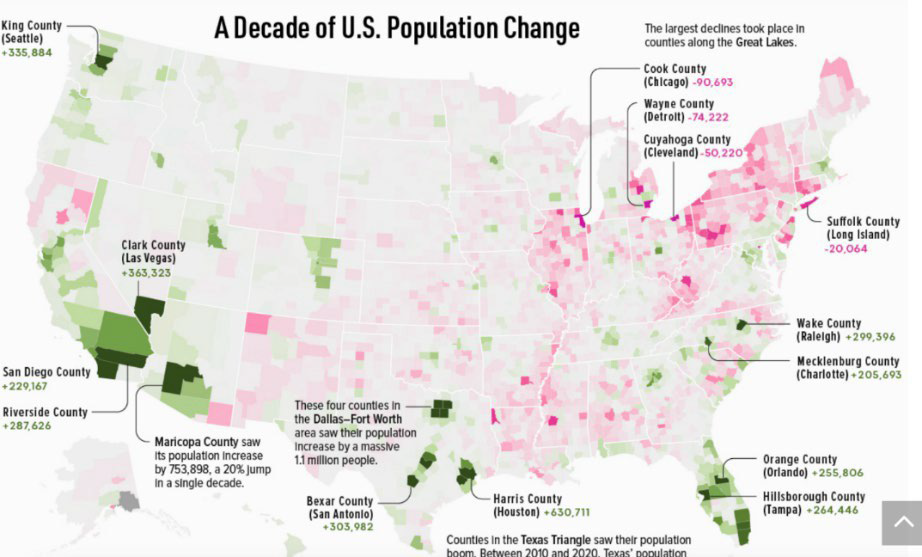
Without immigration reform, the U.S. is destined to experience less economic growth, as I see it. Perhaps it is the lack of immigration policy that results in so many more illegal crossings and border challenges, along with the profound politicization of the issue.
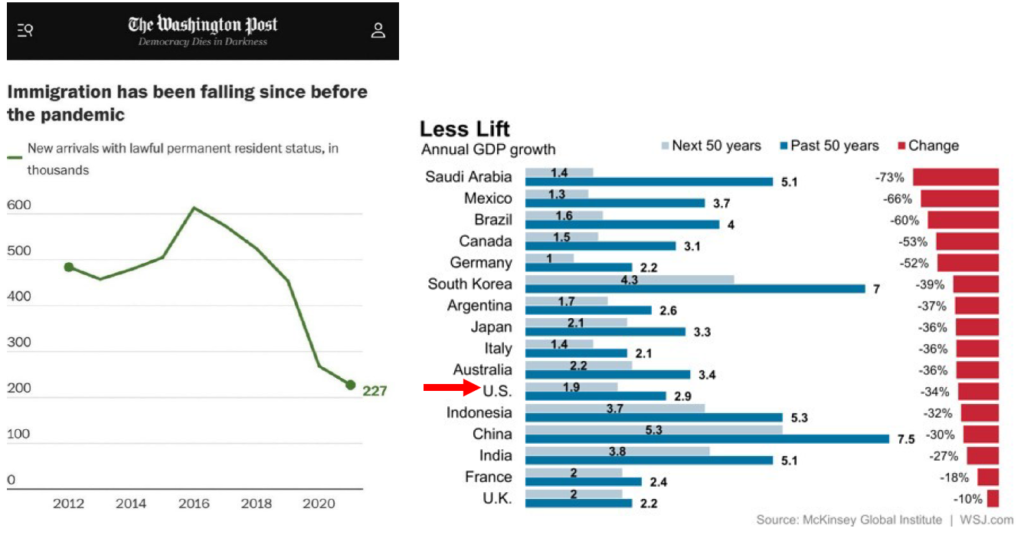
On a related note, China just announced that its population declined last year, falling for the first time in 60 years, reflecting record-low births, consistent with global trends, especially in developed nations. The implications (e.g., economic stagnation, labor supply) are profound and whether China (and others) can reverse the trend remains a significant question mark. I am skeptical and believe that these broad demographic trends (e.g., delayed marriage, declining birthrates) will persist, reducing global growth and inflationary pressures, longer-term.
In conclusion, while 2022 was an entirely forgetful year when it comes to virtually almost anything economic and financial, making predictions for 2023 a bit challenging. However, if history is any barometer, savvy and patient investors will take advantage of the declines in asset values.
I think this 2012 cartoon from the New Yorker captures the challenges, uncertainties, and conflicting data found in today’s markets as well as any:
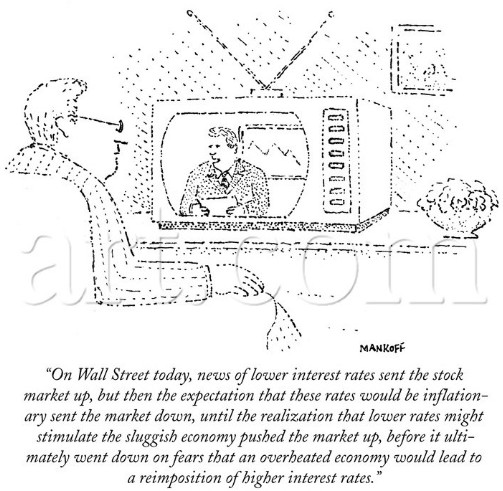
However, while downturns and bear markets test wills, abilities, and balance sheets, they inevitably separate wheat from chaff, acting as a sort of survival of the fittest. The Clear Capital team is going to be managing all assets in the current portfolio with even greater focus and prudence, while hoping to take advantage of any dislocation and distress through strategic acquisitions to add to our portfolio. Some of these decisions will create short-term pain (e.g., reduced/suspended distributions, cash-in refinances), but will be necessary to work through a higher-rate, higher-inflation, more uncertain economic environment.
Before ending yet another lengthy quarterly memo, I would like to leave you with a bit of perspective, if not a tad of optimism. While recently trolling folks on Twitter (probably Elon Musk himself), I stumbled upon a letter that Mark Twain wrote to Walt Whitman on the occasion of Whitman’s 70th birthday. In that letter, a true literary time capsule, Twain took the opportunity to identify several inventions that had taken place during Whitman’s 70 years, all in a tone of profound wonderment: the steam press, steamship, steel ships, railroad, cotton gin, telegraph, phonograph, photogravure (crude photography), electrotype, gaslight, electric light, sewing machine, and surgical anesthesia.
Twain subsequently mentions some of the momentous events that had occurred in that same time period: removal of the French Monarchy, the U.S. Civil War, and the end of slavery. I suppose the point is never to underestimate human ingenuity and progress, and to be profoundly cynical when journalists proclaim the “end of Big Tech” because of an industry slowdown and layoffs. If two pictures can hammer home the point, I give you two, a mere 66 years apart, in 1903 and 1969, respectively:

And finally, in what has become an annual tradition in our fourth quarter letter, I would like to leave my final words to Calvin & Hobbes, arguably the greatest philosophers from the last century, and their perspective as to how important it is that we look forward to 2023, closing the curtain on a very challenging 2022.

Before I sign off, I want to invite you my virtual “office hours” on January 24th at 12 PM PST, where I will be chatting about the markets and other economic/political/business news via LinkedIn Live (https://lnkd.in/gKz6T2qJ). We will also be hosting our 2022 Review|2023 Outlook webinar on February 7th at 12pm PST (click here to register), so mark your calendars for both events! And, last, but most certainly not least, I would like to express my sincere appreciation and thanks to you, our investors, supporters, and friends, as well as the entire Clear Capital and Clarion Management teams for their extraordinary efforts over a challenging fourth quarter and year. I remain grateful and fortunate to work alongside each of you.
Best,
Eric Sussman
“I am so f___ tired of living in unprecedented times.”
- Random person on my Twitter feed
“Youth isn’t wasted on the young. Wisdom is wasted on the old.”
- Raymond Reddington, Blacklist
“Hard times create strong men (people), strong men (people) create good times, good times create weak men (people), and weak men (people) create hard times.”
- C. Michael Hopf
Before getting to the nitty gritty of what was a fairly painful quarter, I would appreciate your momentary indulgence while you join me for a quick dip into one of my very favorite destinations, the “hot tub” time machine. While any time machine would work perfectly well, I have always been partial to the hot-tub variety since the release of that mostly forgettable film series back in 2010. Just to get you in the mood and/or refresh your memories, I will provide a visual cue:

In any event, I would like you to imagine that this unique time machine has transported us back to the fall of 2008, mid-September to be precise. Try to remember where you were, how you felt, and what your views on the economy, markets and investments might have been at the time. For some of you, it won’t take much imagination because you were truly “there,” perhaps living in New York and working for a money-center or other bank, perhaps Lehman Brothers itself, as the world was seemingly on the verge of collapse. For others, we will remember it like a bad dream, like those of us who thought seeing Hot Tub Time Machine 2 was a good idea. And some will barely remember it at all, those of you who were fortunate to have still been in school at the time, and whom I envy just a tad.
Anyhow, Lehman, the 164-year old investment firm with some $700 billion in assets (and more, if you include those pesky off-balance sheet items) literally filed bankruptcy at midnight on September 15th of that year (after Bear Stearns had collapsed in March), setting in motion a global domino effect and crisis: numerous bank and financial firm failures (e.g., Wachovia, Washington Mutual, Merrill Lynch, Countrywide, CIT, IndyMac), the bankruptcies of firms from General Motors to Chrysler to Circuit City to Linen n ’Things, to the sovereign bankruptcy of Iceland, to the bailout of insurance giant AIG. Firms, households, and governments failed or were on the brink of doing so. It is hard to fathom that between October 2007 and March 2009, the S&P 500 fell nearly 60%, 37% in 2008 alone.
Now fast forward to today and how most, if not all, of us feel as we glance at stock prices most days, watch or read the news, peruse our third quarter brokerage statements, and/or consider how this unprecedented rise in interest rates has impacted our broader investment portfolios, including interests in real estate. Now I know a lot of you, predicting where I am headed next, are going to reply with something to the effect of “sure, I remember, and I know. But that’s history. This time is different.”
Ah, the old “this time is different.” Of course, every market crisis is different and I have been through more than a few of them: the stock market crash in October 1987, when the equity markets dropped over 20% in a single day; the global financial crisis and failure of Long Term Capital Management in 1998; the dot-com bubble burst and roughly 80% drop in the NASDAQ between the spring of 2000 and fall of 2001; the Great Financial Crisis (2008-2009); and most recently, the drop in markets at the start of the COVID pandemic when the market dropped roughly 26% in a single month (March 2020).
And so here we are. Knee-deep in what seems to be another crisis, or at least a significant bear market, with its own unique underpinnings: global inflation, an unprecedented increase in interest rates, and widespread geopolitical unrest. Yet the results are essentially the same. Markets are sharply lower, especially equities and fixed income securities. Investors are increasingly nervous, even seasoned asset managers. Commercial real estate prices, especially Class B and C office and retail assets, have declined significantly, with rapidly increasing vacancy rates.
Even multifamily values, which have generally shined in recent years, have declined at least 5 to 10%, if just because the sharp rise in interest rates cannot be offset by lagging increases in rents. Home prices are starting to soften, especially in markets like Boise, Austin, and Phoenix, cities which have experienced the greatest price rises in recent years. The U.S. Dollar has soared, reaching near parity with both the Euro and British Pound. And as though the bad news in the third quarter wasn’t enough, the Dodgers were eliminated shortly thereafter in the first-round of the playoffs, forcing me to watch the Padres face the Astros. Ughh.
The unprecedented interest rate hikes have resulted in nearly $8 trillion in losses in fixed income and equity markets, while investors in 10-year Treasury bonds have lost over 18% year-to-date (through October 15th), the worst performance on record. Several pictures set forth some of the sobering specifics and grim realities about this downturn:

And yet, in every previous crisis or significant downturn, markets and asset prices ultimately recovered, and then some, and I have every confidence that history will repeat itself. However, lacking true psychic powers, I can only state with unwavering confidence that the timing for such a recovery in asset values is uncertain. Academic research, if not common sense, tells us that even the most sophisticated and informed investors cannot time market peaks or troughs. I have repeatedly said that investors are fickle creatures and sentiments change quickly, sometimes shifting imperceptibly and quickly from the depths of pessimism to something very different, like how the coldest and loneliest craps table on any given night in Vegas can become rowdy and euphoric in mere moments and a handful of rolls.
Truth be told, it is not all bad news. Companies are continuing to hire, despite the slowing economy, with the unemployment rate presently sitting at 3.5%, after the economy added 263,000 jobs in September. Consumers are still spending, with the Commerce Department recently announcing that household spending rose by 0.4% in August, after dropping 0.2% in July. Core personal consumption, after stripping out volatile food and energy expenditures, increased 4.9% year over year in August.
While I expect spending to slow, retail sales and consumer spending have not fallen off the cliff as one might have expected given inflation – especially higher food and energy prices – and the market downturn. In fact, just last week the CEO of Bank of America said that their internal data suggests that the U.S. consumer is “healthy” and that customers “continue to spend freely, using their credit cards and other payment methods for 10% more transaction volume in September and the first half of October than a year earlier.” Other data supplied by Mastercard seems consistent with his perspective. And let’s be clear. It seems to me that consumer spending is contributing to the inflation we are witnessing, as much as supply chain kinks or excessive money supply.

So, how long do I think this downturn will last? What is my best bet as to the timing for an economic recovery? If I had Aladdin’s lamp in my hot little hands, one of the wishes I would make would be that I had the ability to see the future. My next wish would be that I could change it, if desired. My final wish would be that I also had a hot tub time machine. I think a hot tub time machine/Aladdin lamp combination would make quite the holiday gift, along with that Jewish space laser I have heard about. Unfortunately, while I continue to search for such a lamp, I have thus far been unsuccessful, though there were a few listings for “Aladdin’s Lamps” on eBay and Etsy. I remain skeptical, however, since they are all “pre-owned” with the potential wish-granting powers likely exhausted. The prices for such lamps also seem suspiciously low.
Anyhow, in many presentations I gave between 2011 and 2015, I would ask audiences a sort of rhetorical, but important, question: how long after March 0f 2009, when markets bottomed, did they begin feeling better, more optimistic, and start investing again? 2010? 2011? When did the memories of the Great Financial Crisis fade into the investment past? The answers to these questions likely provide clues as to the question posed above as to how long the downturn will last, since investor psychology plays such a significant role in financial markets and investing.
Historical data tells us a lot. While the S&P 500 dropped 37% in 2008, it was up over 26% in 2009 and over 15% in 2010, virtually recapturing all losses, and by the end of the 2012, that 37% loss had turned into a nearly 10% gain. Since 1990, the NASDAQ has experienced annual increases and decreases in value of over 30%, 11 and five times, respectively. In eight different years since 1990, the NASDAQ has increased over 40%, but only in 2000 did the NASDAQ decline that much. The conclusion? Trying to time markets is a fool’s errand. Bear markets last an average of 13 months and the S&P 500 slipped into an official bear market on June 13th of this year, while the NASDAQ entered bear market territory in April.

Does this mean that the market will turn during the latter half of 2023? Well, I only wish I could be that prescient, of course, but I would not be shocked if such a reversal came to pass. After all, there is still a heck of a lot of cash and capital sitting on the sidelines. I have provided this graph several times in previous updates, setting forth M2 money supply or the total value of currency held by the public, including demand deposits. While it has ticked down slightly in recent months, as bank depositors pulled about $270 billion from accounts in recent months, about $22 trillion remains on the sideline, very near an all-time high. Some of this capital, along with the $30 billion in equity that Blackstone just raised in its tenth fund and other “dry powder,” will most certainly find its way back to the markets in due course.

This is not to sugarcoat or ignore the significant uncertainties and challenges that lay ahead: inflation everywhere one looks; the Russia-Ukraine conflict and impact it has had on energy prices and the economies of Europe and the U.K., the latter which will have its third different prime minister in a matter of months; China and its significant economic challenges; the strong dollar (up nearly 20% this year, the biggest rise in 40 years) and the havoc it is wreaking on international markets, especially economically developing nations; the upcoming markdowns in private market asset values in everything from real estate to venture capital to private equity; and, of course, how central banks might respond with whatever tools they have in their toolboxes and whether those tools, including increases in interest rates, prove effective.

In part, one of the issues that is likely to determine how deep and how long this (or any) bear market lasts is systemic leverage. That is, with excessive debt and leverage, the risks that a market downturn persists and/or deepens increase. The process is depressingly intuitive. Asset prices decline, driving values below debt levels, margin calls are made (or foreclosures commenced), assets are sold under duress, and asset values are driven down further, and the process repeats.
So, how much leverage and debt are out there? How much systemic risk exists?
If one looks only at U.S. money-center banks (e.g., Wells Fargo, Citibank, Bank of America), their balance sheets appear adequately capitalized. In fact, according to the most recent “stress tests” conducted by the Federal Reserve, “capital levels remained above required minimums.” Fitch, one of the large credit rating agencies concluded that “U.S. bank capital levels remain robust” and they expect the banks’ earning capacity and capital balances to be “more than sufficient.” However, certain foreign-based banks (e.g., Credit Suisse, Deutsche Bank, UBS) are more leveraged and at risk. Moreover, in recent years, the “shadow banking” industry – think unregulated debt funds providing capital to asset managers in private equity, real estate, and venture capital – has ballooned.
These firms (e.g., Blackstone, Centerbridge, Cerberus) typically provide short-term and variable-rate debt financing to real estate asset managers like Clear Capital or corporate private equity firms to fund acquisitions and repositioning strategies, and it is virtually impossible to know how much of this debt is out there, as they are largely unregulated. It is certainly hundreds of billions, and this segment of the capital markets has grown substantially in recent years. It is this debt which is most likely to create distress as the debt issued by these funds tends to be variable and shorter-term in nature.
How these funds respond to leveraged borrowers and asset distress remains to be seen. Much depends on whether the Federal Reserve is successful in tamping down inflation and interest rates, the hedging strategies employed by particular borrowers, and the financial strength and experience of borrowers. We shall see. Let’s just say that I am glad that Clear Capital and its principals have extensive experience in these markets, solid capital reserves, and a focus on the multifamily market where fundamentals remain strong (see below). Having said that, we, too, have a significant amount of floating-rate debt across our portfolio and even though it is hedged, the relevant rates and borrowing costs have increased considerably in recent months.

My sense is that less experienced borrowers, “zombie companies” (those with negative free cash flows and business models that may not be sustainable), and private equity firms with less of a track record and less capital are at the greatest risk in the current market environment, assuming interest rates remain high or continue to increase. While I believe workout specialists and bankruptcy attorneys will be busy bees in the next 12 to 18 months, I don’t see the sort of systemic risk here in the U.S. that existed back in 2008 to 2009. That is, this downturn is not a banking crisis. I also predict that most lenders will work with borrowers when practical, knowing that forcing borrowers into bankruptcy and/or taking back assets often leads to suboptimal outcomes.
How have residential real estate values fared so far in 2022 given the economic dislocation? What is happening on the rent and occupancy front? Have the fundamentals changed and what is the outlook for the sector?
In the multifamily market, we are witnessing a period of “price discovery,” as sellers remain in a state of nostalgia, if not denial, failing to appreciate that asset values have declined (perhaps temporarily) by at least five percent and likely more, while buyers are hoping to pick up prices on the cheap, hoping to take advantage of price dislocations and distress. Each is off on their timing. The math, yet again, is simple, if not sobering. Interest rates have risen so much and so quickly, immediately increasing borrowing costs, while rental growth lags.
Hopefully, interest rates will moderate in response to the Fed’s discount rate sledgehammer (they raised rates 0.75% at the end of July and Fed rhetoric foretells rate increases to come), while rents will continue to grow, perhaps less rapidly than they have in recent years. However, not even 9% year-over-year rental increases, as we saw in September, can compensate for the new, if even transient, yield-curve and interest rate reality. At last glance, the 10-year Treasury yield approximates 4.25%, up some 42 basis points (0.42%) since the end of the third quarter. That is a remarkable move, following other remarkable moves. I can relate to what that anonymous tweeter that I quoted at the start of this letter feels. In any event, the short-run impact of these interest rate moves on asset cash flows and values are not inconsequential, and patience and prudent asset management have become even more paramount.

And 30-year fixed rate mortgage rates? They have mimicked the move in U.S. Treasuries, with record-setting increases.

Not surprisingly, in the face of economic uncertainty, substantial declines in equity values, and a drop in consumer confidence (which hit an all-time low in June, according to the University of Michigan), rents declined in September, the first monthly drop since December 2020. Specifically, they declined 2.50% between August and September, according to Redfin. Of course, they are still up 23% since August 2020 and should rebound given that the underlying demand and supply fundamentals for multifamily assets remain squarely intact, and we have seen this play before, in previous crises or downturns. Rents decline through downturns but then recover strongly. I anticipate this history will repeat itself, at least in time. However, I think it is also safe to say that the double-digit rent increases we have witnessed in recent years have gone south for the winter, and likely beyond, so to speak.

One of the drivers of multifamily demand has been the decline in “home affordability,” which sits at the lowest levels since 1989. It may be mixed emotions, but such affordability challenges present substantial tailwinds for the multifamily market. I see nothing that will derail this trend, which I see as long-term and structural. Most future housing needs will be satisfied by higher-density, multifamily units. The “American Dream” of homeownership will likely become a compromise of sorts, perhaps the less fulfilling dream of living in a well-appointed, Class A apartment, in a project with all the fixings: pool, clubhouse, gym, dog park, business center, laundry services, etc.

I suppose it can come as no surprise that according to the WSJ/Realtor.com Emerging Markets Index, released this summer, Elkhard-Goshen, Indiana is the top “emerging housing market,” based on “solid economic fundamentals, in-demand amenities and lifestyle options, along with a critical dose of affordable homes.” Elkhard-Goshen was followed by Burlington, North Carolina, Johnson City, Tennessee, Fort Wayne, Indiana, and Billings, Montana in the rankings. I can honestly say that I have never considered investing in these particular markets and would have difficulty identifying any of them on a map.
Maybe that is the very point. The best housing markets in the future won’t be found on our coasts, downtowns (Central Business Districts), or in the heart of cities that have been such attractive destinations for new residents over the past decade (e.g., Atlanta, Nashville, Charlotte, Phoenix, Boise, Austin, and Dallas). These are trends that have accelerated since COVID made its unwelcome appearance and remote work became a viable option for many professionals and households. It is all about where that proverbial “puck is going” and not “where it’s been.”

One other challenge contributing to the lack of single-family affordability relates to a rhetorical question recently posed in an article from the New York Times: “Whatever Happened to the Starter Home?” In the 1990’s, a typical “starter home,” a three-bedroom, two-bath home, was 2,000 to 2,200 square feet and cost about $100K. Today? That same home would be 2,300 to 2,600 square feet and cost five times as much. Some of these changes and the higher prices that follow have been caused by increased land and construction costs, minimum lot sizes required under local zoning rules, and increased infrastructure requirements (e.g., green spaces, community resources).

Another byproduct of the drop in housing affordability and perhaps a partial explanation of the increasing size of single-family homes is the growing trend towards multigenerational households living under one roof. Such a phenomena is routine elsewhere, but historically has not been the case in the U.S. Well, just as “necessity is the mother of invention,” high housing costs are compelling many generations of the same family to cohabitate. Seeing Charlie Bucket, his mother, Hellen, Grampa Joe, Grandma Josephine, Grandpa Ubeck, and Grandma Georgina all crammed into a small house in Charlie and the Chocolate Factory always seemed a bit strange to me, even as kid mostly interested in the darn chocolate. But that may soon be more of a norm.
This prediction is supported by a couple of recent studies, the first out of Harvard and sponsored by the U.S. Census Bureau, which concluded that Millennials don’t stray too far from where they grew up. The study found that by age 26, more than two-thirds of young adults in the U.S. lived in the same area where they grew up, 80% lived within 100 miles, and 90% within 500 miles. Migration distances were shorter for people of color and those of financial means (read: wealthy). The reluctance of Millennials to move far away is backed up by other studies showing declines in mobility. Of greater interest, I think, was a second study, based on a Pew Research Center Survey, which showed that a quarter of U.S. adults aged 25 to 34 resided in a multigenerational household in 2021, up from just 9% in 1971.

In any event, as a result of the higher mortgage rates and declining consumer confidence (and to nobody’s surprise), single-family home sales have fallen for eight straight months. And let’s face it. Any homebuyer who was lucky enough to secure a 3-ish%, 30-year fixed rate loan (or even lower rates on 15-year mortgages) during 2020 or 2021 is not going anywhere, as they are restrained by these mortgage handcuffs. They cannot afford a higher-priced replacement house, with 30-year mortgage rates approaching 7%. In addition, I recently read that Blackstone and its single-family rental business had ceased home purchases in 38 cities, including Boise, Fresno, and Memphis. Other institutional homebuyers – Invitation Homes, American Homes 4 Rent, and KKR’s My Community Homes – are among the institutional landlords that have also slowed home purchases. As a result, existing-home sales dropped 0.4% in August from July and nearly 20%, year-over-year.

It really is a question of geography, however. While existing-home sales declined in every region of the country, certain markets, specifically those that saw the greatest growth and appreciation in recent years, have seen the sharpest drops in transaction volume, cities like Boise, Austin, Phoenix, and Atlanta.

As a sidenote, this seems like an appropriate place to add that I expect upcoming sales figures from the likes of Bed, Bath, & Beyond to Home Depot to Lowes to my beloved Costco to suffer from these declining home sales. Fewer home sales translate to fewer furniture purchases and fewer trips to building supply stores and other retailers that generate significant sales from new homeowners. Consistent with this thesis, Restoration Hardware recently indicated that it expects net revenue to drop between 15 and 18% this quarter. In addition, U.S. mortgage lenders, especially those that are non-regulated and not required to maintain certain minimum levels of capital reserves, are feeling the pain. First Guaranty Mortgage, majority owned by PIMCO, the large investment management firm, recently filed for bankruptcy, and I suspect they are the first of many mortgage lenders which will fail.
However, in the face of declining sales volumes, home prices overall have remained reasonably firm, at least in most markets, as I have predicted. It is simply a story of inadequate supply and pent-up demand. In August, the median home price for existing-home sales across the U.S. increased 7.7% year-over-year, though they declined 0.7% month-over-month. I believe home prices overall will decline five to 10% nationally, with certain markets, the likes of Boise, Phoenix, and Austin, falling further. It is a question of gravity to some extent (“what goes up…”) and the thesis is supported by recent data out of Boise.

Regardless of what the demand for housing may be looking forward, the real story remains on the supply side
Over the years, I have repeatedly pointed out that the increasing cost and difficulty in adding to our housing stock, both single- and multifamily, essentially guarantees that real rents would increase over time, a story that has played out, certainly for better and worse. That continues to be the case. Everything from the lack of buildable lots, increased building costs, a shortage of labor and contractors, restrictive neighborhood CC&Rs (covenants, conditions, and restrictions) and good old NIMBYism remain a persistent and consistent theme. And now we throw higher borrowing costs into the mix. The net result is that it becomes harder and harder for potential construction projects to pencil. While housing starts unexpectedly increased 12.2% in August from July, housing permits issued, foretells future construction, declined 10%.

Affordable housing projects, those dedicated to tenants whose incomes fall below certain thresholds, are becoming increasingly hard to finance, as they become squeezed not just by the higher construction and borrowing costs, but by the inability to receive market rents, an economic vice of sorts. Without substantial subsidies and/or other financial support (e.g., tax credits), these sorts of projects are not viable, sadly dead on arrival.
Meanwhile, a recent study published by the National Multifamily Housing Council and the National Apartment Association found that 4.3 million more apartment units will be needed by 2035 to meet anticipated demand. Developing needed units at affordable rents will be no easy task. One particular anecdote from this past quarter highlights the challenge. You may have read the story about how Marc Andreesen, the founder of Netscape and a well-known (and very well-heeled) venture capitalist and his wife, actively protested the construction of a whopping 58 apartment units in their tony “enclave” of Atherton, California, a hop, step, and jump from the Stanford campus, where the average home sold for nearly $8 million in 2020 and where more affordable housing is desperately needed to house the folks that educate their kids, serve them food and drink in local (mostly upscale) dining establishments, or just bag their groceries.
As part of their protest, the Andreesens and other of life’s lottery winners submitted letters to City Counsel expressing concern about not just “traffic, tree removal, light and noise pollution, and school resources,” but “massive decreases in home values.” The obvious hypocrisy becomes even more evident when one considers that Mr. Andreesen recently agreed to invest $350 million in Flow, a new start-up led by WeWork founder, Adam Neumann, whose strategy is to address the country’s “affordable housing problem.” In a related story out of Woodside, an Atherton-adjacent community, the Woodside government announced that it was designating the city as a “sanctuary for mountain lions” in order to avoid a new law requiring that a certain amount of housing be added to their community. California’s attorney general sent a letter to the city (certified, I am sure), accusing Woodside of “deliberately attempting to shut off the supply of new housing opportunities.” Only after the Department of Fish and Wildlife advised officials that the proposal was illegal, that it could not designate the entire city as a mountain lion habitat, did the city relent. You can’t make this stuff up.
In another thought-provoking and relevant article, the Wall Street Journal argued that the U.S. is “running short of land for housing.” Perhaps we can file this story under the old adage from Will Rogers, that we should all “buy land” since “they ain’t making more of it.” While any flight over the middle of the country would seem to confirm that we have plenty of empty land, much of it is not buildable, lacks any infrastructure, has no meaningful source of water (worsened by climate change), and is expensive, having nearly doubled in price over the past 15 years. Much of the land is owned by the Bureau of Land Management and is not available for sale or development.

And inflation? What is driving it? Supply chain issues? Excess liquidity and money supply? Robust consumer spending?
I don’t think it would be too controversial to argue that inflation remains the most significant uncertainty the markets face and thus far, the data continues to be sobering. September consumer prices increased 8.2% year-over-year, and even if we were to exclude volatile food and energy prices, inflation clocked in at 6.6%. The culprits continue to be a little bit of this and a whole lot of that, but let’s not kid ourselves. Supply chain challenges and excess money supply may be contributors, but we should not and cannot understate the impact of the consumer, who continues to spend.
The net result is increasing costs of anything and everything, from housing to food to energy to insurance to booze to airfare to hotel rooms. And it doesn’t matter whether you are staying at the Four Seasons or if Tom Bodette is leaving the light on for you. Wages, while on the rise, are playing catch-up, unless you are a lobbyist or free agent in professional sports.

You may recall that in previous memos I discussed how the very modest inflation we have witnessed over the last 20 years might be the byproduct of certain exogenous realities: the “three A’s” (Amazon, automation, and artificial intelligence) and the outsourcing of manufacturing and certain services (e.g., call centers) to lowest-cost markets (e.g., Southeast Asia, China, India), Fed policy, and even the pandemic. However, one has to wonder if some of these trends, along with an aging demographic, are reversing, creating inflationary pressures.
Here is the thinking. Over the past decade, increasing asset values (principally stock prices and real estate) compelled the departure of those 55 and over (read: asset rich) from the workforce and allowed for their early retirement (kudos to Tom Selleck and those reverse mortgages). According to the U.S. Census Bureau, around two million workers are “missing” from the U.S. labor force, after accounting for slower population growth and the aging of the population. The result is a decline in the supply of available labor. Meanwhile, these sprightly retirees consume, and according to research, consume even more than they did before. While they might purchase fewer capital goods (e.g., homes, autos), they increase spending on everything from travel and leisure to healthcare, thereby increasing inflation, net-net. In addition, with fewer available workers, wages rise and create the potential for a wage spiral. The dual Fed mandate of “full employment” and “price stability” become incompatible. Such a thesis seems plausible and may mean that inflation will not prove transient no matter how much the Fed increases interest rates.

However, declining asset values may reverse this trend. With the S&P 500 and NASDAQ down 23.2% and 32.3% year to date respectively, at last glance, some deflation is quite transparent. Softening rents and housing prices are also clearly deflationary. Moreover, inflation is expected to ease if the inverted yield curve or investor surveys are to be believed. On the other hand, it would be naïve to assume that inflation will approach the Fed’s two percent target anytime soon.

The labor market, at or near full employment, continues to shine, though layoffs loom
As mentioned above, the national unemployment rate sits at 3.5%, matching July’s 29 month low and better than the expected 3.7%, according to those economic pundits. Thus far we have experienced a job-creating slowdown, the flip side of the more often witnessed “jobless recovery.”

However, with many firms recently announcing job cuts – U.S. employers announced nearly 30,000 job cuts last month, a 46% increase from August – I sense that the labor market is beginning to experience a sort of bifurcation, where employment levels decline and job cuts accelerate, while the economy softens, and wages rise. Hearing that the IRS plans to add nearly 90,000 new agents by 2031 is truly the definition of mixed emotions (replacing the more traditional definition, seeing your mother-in-law drive off the cliff in your new Mercedes).

Traditionally, the Phillips Curve (named after the economist A.W. Phillips) predicts that inflation and employment have a stable and inverse relationship. Simply put, economic growth creates more jobs, higher employment, and inflation. However, the “stagflation” experienced in the 1970’s, where both inflation and unemployment levels were high called the theory into question, and it remains to be seen whether 2023 will represent the unwelcome sequel to the late ‘70’s. If recent job openings data prove probative, such may be the base. In August, the number of job openings in the U.S. dropped to 10.1 million, the lowest level since June 2021, and down from a record of 11.9 million in March.
Meanwhile, even with wages increasing five percent in September, real wages, after inflation, declined 2.5% from the prior year, and 0.1% month-over-month. As I have mentioned many times before, higher wages will allow households to pay more rent, so it is generally something we welcome, provided it does not create excessive inflationary pressures and higher interest rates, those good old mixed emotions yet again.

After a springtime lull, policy makers had active summers as they continue to try their darndest – albeit unsuccessfully – to address the issue of affordable housing
In just the last month, two articles really caught my eye, one in the Economist, (“More Cities are Passing Rent Control Laws. Is That Wise?”) and another, from the New York Times (“Rent Revolution is Coming”), confirming trends I have seen coming for some time. It is all so predictable, and contrary to common belief, it isn’t a blue or red state thing. In fact, the Times’ article focused on Kansas City, Missouri, where a recent city council meeting was repeatedly interrupted by chants from protestors in attendance: “The rent is too damn high! The rent is too damn high!” With a modest population of 500,000 and a median home price well below that of countless other locales, one would not usually think of Kansas City as some sort of hotbed for a renter uprising.
Yet, even in the reddest of states, unhappy constituents are seeking help from politicians, who are eager to place and pander for votes. This unhappiness extends across the economic and political spectrum. On one end are renters who aspire to purchase a home but have had their dreams dashed by high mortgage rates and high home prices. On the other are low(er)-income tenants, who make up the bulk of the 11 million households across the country which spend at least half of their income on rent. And in between? A hollowed-out middle class steadily finding themselves stuck in the proverbial middle, unable to qualify for rental assistance (or sympathy) and finding a greater share of their incomes going to rent.
Thus, it should come as no surprise that rent control has found its way to Florida, a state which banned the practice in the late 1970’s. In August, officials in Orange County, Florida, located in the center of the state and home to Orlando, placed a rent control measure on November’s ballot, which would limit rent increases to the consumer price index. They also approved a measure requiring landlords to give 60-days of notice before any rent increase of more than 5 percent can be implemented. In June, lawmakers in South Portland, Maine voted to limit annual rent increases to 10%.
From Pomona, California to Kingston, New York, to a local community near you, additional rent restrictions and controls are a-comin.’ In Nevada, the North Las Vegas City Clerk rejected a petition to include a rent control measure on the November ballot citing “insufficient valid signatures.” The petition, initiated by the Culinary Workers’ Union Local 226, failed to reach the 15% threshold of voters who had voted in the previous city election, according to Rodgers. The union is seeking a review of the ruling.
In Maryland, The Montgomery County Council held a public meeting this week which included discussion of a proposed measure that would place a 4.4 percent cap on rent increases. Several organizations and property owners spoke out against the bill at the hearing. I can only imagine when residents in Idaho, Utah, and Montana sporting Make America Great Again hats, waving American flags, and shouting from the rooftops about the dangers of socialism begin lobbying local politicians to “just do something” about the higher rents in Boise, Salt Lake City, and Billings. It seems that everyone becomes a socialist when money earmarked to them is at issue. Or when the rent is “too damn high.”
Finally, back to good ol’ California, which passed statewide rent control in 2019, recently passed Senate Bill 6, which allows residential construction on commercially zoned properties without the lengthy and costly rezoning requirements. Thus, in theory, vacant stores could be converted to housing. However, the law is no panacea. While it might streamline approvals and ultimately allow for the development of more housing, it fails to address the other significant impediments to new supply, discussed above (e.g., soaring costs and higher interest rates, a lack of labor, environmental reviews). Finally, Los Angeles’ City Council voted to finally allows landlords to evict tenants whose rents are in arrears, but not until next February. That’s right, next February. As Tom Petty said, and said well, “the waiting is the hardest part.”
And, of course, I would be remiss if I failed to include some other tidbits I found interesting and which impact real estate markets, values, and/or transactions
- The U.S. population is getting older and poorer, and Gen-Zs are in no rush to walk down the aisle: one of the biggest concerns that I have and have repeatedly expressed is that the U.S. is mimicking Japan in terms of demographic trends. Between 1955 and 1990, Japan’s GDP grew at an impressive 12% per year. However, since then Japan has grown anemically, 0.6% per year, principally resulting from not just an aging populace, but a declining one. With Gen-Zers taking their sweet time to not only marry and procreate, despite ABC greenlighting and airing more episodes of The Bachelor and Bachelorette than ever, our fertility rates are declining rapidly, and we are headed down a similar path. The inability of Democrats and Republicans to get their you know what together and pass meaningful immigration reforms and policy isn’t helping.


Meanwhile, the Gini Coefficient or “wealth inequality index” is at its widest, 0.494. Nearly 38 million Americans, or nearly 12% of our entire population, are considered poor, a 10% increase over 2019, before COVID.
- The commercial real estate market is showing some cracks: for the first time since the start of the pandemic, commercial real estate asset values (e.g., office, retail, and industrial) are beginning to soften.

The office market is significantly oversupplied. The trend towards reducing the amount of office space a tenant rents per full-time employee had begun to fall about ten years ago, as “creative,” or more open-air, office plans became popular. Throw in technological advances and a dose of COVID and remote work, and you have a near crisis on your hands. The physical vacancy rate for office space in Los Angeles is 20%, but brokers will tell you that the economic vacancy is more like 30%.
In fact, I just read that L.A. office tenants have put some 9.6 million square feet of sublease space on the market, up from 9 million square feet at the end of the second quarter and 8.2 million square feet at this time last year. But according to brokers, takers are few and far between. Meanwhile, in the Big Apple, KPMG just announced that it is reducing its N.Y. office space by 30%. I really would not want to own any Class B or Class C office space, just about anywhere. The fundamentals are not pretty.

And the industrial market? It, along with multifamily and self-storage markets, has been the hottest sector in commercial real estate in recent years, driven by growth in on-line retail (Amazon itself has been a voracious consumer of industrial space in the past decade), last-mile delivery, the legalization of cannabis, and the onshoring of production of certain goods driven by pandemic demand. While national vacancy rates are still very low, they have recently risen to 3.2% from 3.0%. However, the market is beginning to show some modest cracks, as Amazon has mothballed several projects and many retailers are dealing with bloated inventories.

- After decades of tremendous economic growth, the Chinese property market is imploding and overall economy slowing significantly, leaving it with some difficult policy choices: I was last in China in 2017 to teach one of UCLA Anderson’s “global immersion courses” during which one speaker after another fawned over China’s long-term vision and extraordinary commitment to growth, innovation, and capital investment. This hyperfocus on capital investment generated extraordinary wealth, transformed the country and countryside, increased borrowing, but increased wealth inequality. Now, with the global economic slowdown and post-COVID realities, China’s investment-centric strategy has left it with some unenviable choices. While investment typically comprises a quarter of global GDP, China has invested 40 to 50% of their annual GDP into infrastructure (including property development) and investment. If you think U.S. Fed Chair, Jerome Powell, has a tough job trying to steer our economy to a “soft landing,” China’s job is far more challenging.
Look no further than their property market, where the government had to clamp down on developers who had taken on way too much debt in the name of growth. In fact, the Chinese property market is likely the single largest asset class in the world.

So, what next? Unlike Magnus Carlsen, the Chess Grandmaster, Chairman Xi can’t just walk away from the game. Perhaps the country shifts from private real estate growth to public infrastructure (e.g., bridges, roads, Silk Road), but this sort of investment is not necessarily productive. All I know is that a significant slowdown and tough choices await, while consumer confidence plunges.

With the risk of stagflation seeming more and more of a possibility, real estate fund managers and sponsors will need to manage assets even more carefully, focusing on occupancy versus rent growth, managing expenses and expenditures carefully, and conserving capital
You don’t have to look very far to read, see, or hear bad news these days and perhaps it is darkest before dawn. UCLA’s extremely disappointing showing on the gridiron yesterday would seem to support that notion. Regardless, it never ceases to amaze me how quickly investor sentiment shifts, and when this particular market bottoms, it will only have been evident in the rearview mirror. While the next 12 to 18 months is going to be very bumpy, I am sure that long-term investors, exercising patience, will be rewarded. I also sense that the downturn will present opportunities, as they inevitably do.
The Clear Capital team, like all sponsors, will have its hands full, especially with assets we own with floating-rate debt. As I mentioned in a short memo I recently wrote, while we generally hedge this debt with interest rate caps, such caps expire two to three years following acquisition. As a result, we will carefully balance occupancy rates with rent increases, emphasizing the former over the latter. And while I hate to reduce investor distributions (remember that the Clear Capital principals and affiliates are generally the largest investors in our projects), I believe it is crucial that we (and all sponsors acting responsibly) increase cash reserves and manage all cash outflows as conservatively as possible in such broad market uncertainty. Frankly, it is in the tough markets when sponsors earn their keep and wheat is separated from chaff.
In that regard, we had a busy quarter, refinancing Aspire of the High Desert, returning over 80% of investor capital, while selling two assets, Iris Gardens and Aspire Glendale, on which investor returns are anticipated to exceed 32.3% and 36.4%, respectively. We acquired one asset, Aspire Columbia Ridge in Portland, Oregon, with our joint venture partner and for which we are presently raising capital (for up to half of their investment). We like the asset and the real estate, and should you be interested, please let us know.
As November and the holiday season are almost here, the Clear Capital team and I want to pass along our very best wishes to you and your families for a healthy and celebratory holiday season. I would also like encourage all of you to get out there and vote, provided you are able to so. While I generally avoid political discussions in these memos, or try to stay reasonably agnostic in my writings, we cannot and must not take our democracy (or indeed, our Republic) for granted. This picture says it all, as electoral and liberal democracies are seemingly out of favor these days and that worries me. Certain trends pose existential threats, even more than higher interest rates and inflation.

As always, thank you for your continued support of me and our entire team. Feel free to reach out to with any questions, comments, or concerns that you might have.
Best,
Eric Sussman
Managing Partner
“A cynic is a man who knows the price of everything, but the value of nothing; a sentimentalist
is a man who sees an absurd value in everything, but doesn’t know the market price of a single
thing.”
-Oscar Wilde
“Too many people spend money they haven’t earned to buy things they don’t want
to impress people they don’t like.”
-Will Rogers
“I love bringing that sparkle, the rainbow, and the sun to everything I do.”
-Paris Hilton
Some of you long-time readers of Clear Capital’s quarterly memos will recognize that
there are three quotes at the top of this letter as opposed to the typical two. Well, with
inflation being so widespread and of significant concern, especially following last
week’s report that the June Consumer Price Index reached another multi-decade high,
increasing 9.1% year-over-year, I decided, in sympathy, to inflate by 50% the number of
quotes with which I begin this quarter’s newsletter.
Besides, with so much tough news coming out of this quarter – from higher inflation to
significant increases in interest and mortgage rates, swooning equity and bond markets,
the specter of recession, the ongoing war in Ukraine, ever-growing gun violence,
shortages of baby formula, the (predictable) crash in the cryptocurrency markets,
sobering revelations from the January 6th Commission, controversial Supreme Court
rulings, to yet another rapidly spreading Covid subvariant – it hasn’t been a quarter
worth remembering or celebrating.
So why not start this memo with an uplifting, if not incomparably vapid quote from
Paris Hilton in an attempt to bring a “little sparkle, rainbow and sun” to an otherwise
forgettable quarter and an equally droll quarterly newsletter? Well, before I douse you
with too much sparkle and rainbow, here is a look at last week’s sobering inflation data:

And as though the inflation story could not get any worse, I am still reeling from the
very recent announcement that Costco is raising some of their food court prices, with
the price of a chicken bake and a standalone soda being increased by $1.00 and $0.10,
respectively. The severity of the blow was tempered, however, by the welcome news
that they are not increasing the prices of either the hot dog/soda combination or the
price of their rotisserie chicken. Phew. If and when that happens, my faith in capitalism,
my Executive Costco membership, and view of life itself may collapse entirely.
So, it is for posterity and nostalgia’s sake (and a touch of sparkle and rainbow), that I
provide these important photos, to remind us of the way things used to be, them “good
ol’ days” and just how perverse inflation can be:

So, just how bad is inflation? Well, even family-owned Arizona Iced Tea, which had
stubbornly held onto its $0.99 price per can, announced this past week that it is
increasing the price of each can to $1.99, still less than its competitors, but one heck of
an increase. And how about the strongly rent-controlled City of Santa Monica,
affectionately and occasionally referred to by locals as the “People’s Republic of Santa
Monica,” approving the highest rent increase in 40 years, allowing landlords to hike
rents by six percent this year?
The two graphs below also confirm what many of us already know. Inflation has really
impacted travel costs, and we are not just talking about a gallon of gas.
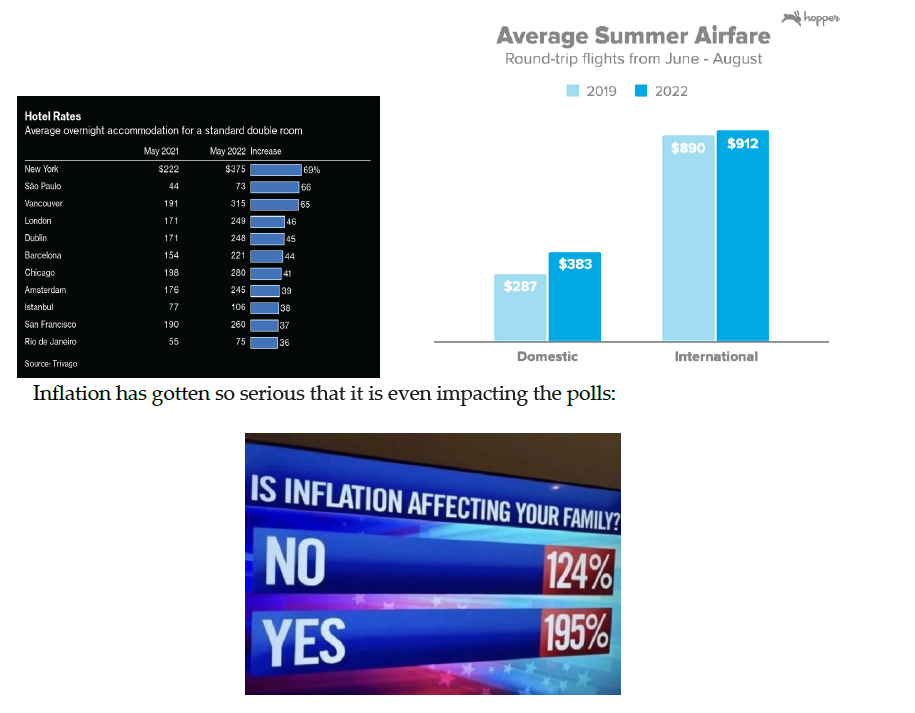
Well, the Fed has not stood by idly, and following May’s inflation data (an 8.6% yearover-
year rise), Fed Chair Jerome Powell took a page out of Paul Volcker’s 1981 Federal
Reserve playbook, “How to Quell Inflation Regardless of the Consequences” and, along
with his colleagues, raised interest rates by 0.75%, the largest such increase since 1994.
Canada increased its discount rate by 100 bps (1%) last week, and most expect the U.S.
to follow suit with a similar increase later this month.
Keep in mind that Chairman Volcker faced far more daunting, double-digit inflation
when he was appointed Fed Chair in 1979. Inflation was rising at over one percent each
month and home mortgages averaged 11.2% at the time. The Fed Funds rate was just
under 11%, and by June of 1981, after a series of aggressive moves to quell inflation, the
Fed Funds rate exceeded…wait for it….19%. Imagine that. 19%.
The response to the Fed’s recent actions has been predictable: a significant upward shift
in the yield curve, especially on the short (up to two years) end. Yields on two-year
Treasuries, which stood at 0.78% at the beginning of 2022, are now yielding 3.13%, a
more than fourfold increase.
And ten-year yields? They have increased to nearly 3.0% (2.93% at last glance), up from
1.63% at the end of 2021. Yes, you are reading the data correctly. Yields on two-year
Treasuries are currently yielding 20 bps (0.2%) more than those on ten-year bonds, at
least as of the end of last week.
Oh, one last thing, though I am not sure it will make you feel any better. Despite all the
rhetoric and misplaced blame, inflation is a global phenomenon. Inflation in the EU has
been tracking slightly higher than that in the U.S. and many countries are experiencing
double-digit inflation.
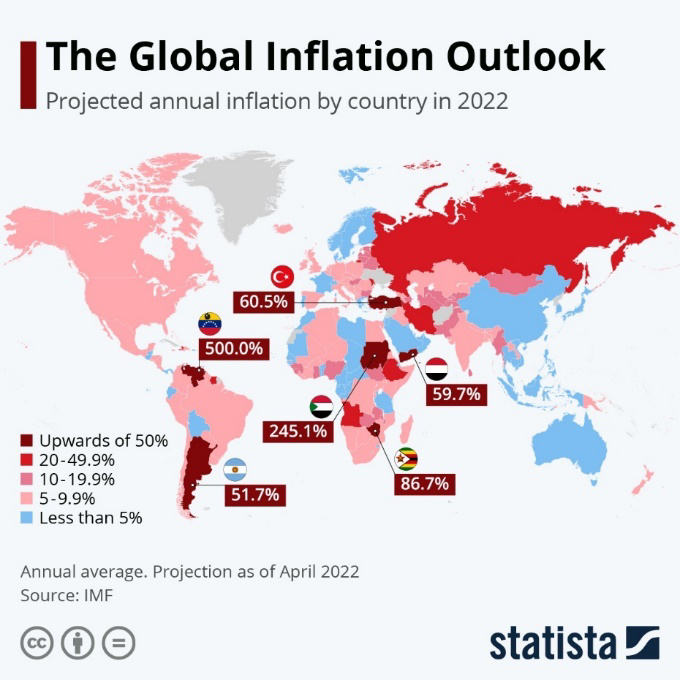
What does this mean when short-term interest rates are higher than longer-term ones?
Is a recession imminent?
Inverted yield curves often precede a recession, and while the jury is still out on
whether we will experience a recession (two consecutive quarters of a drop in GDP),
investors and the markets are clearly expecting the U.S. economy to slow, to slow
dramatically, and for inflation and longer-term interest rates to subside as a result.
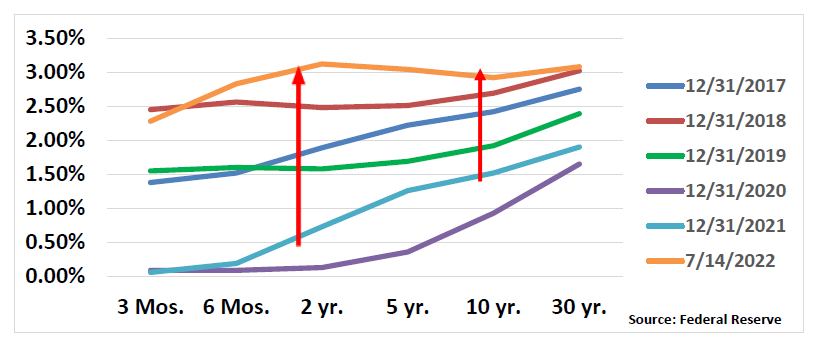
This conclusion is consistent with the following data, which indicate that while
investors expect short-term interest rates to continue to increase into 2023, they
anticipate that inflation will drop to near 3% within five years:
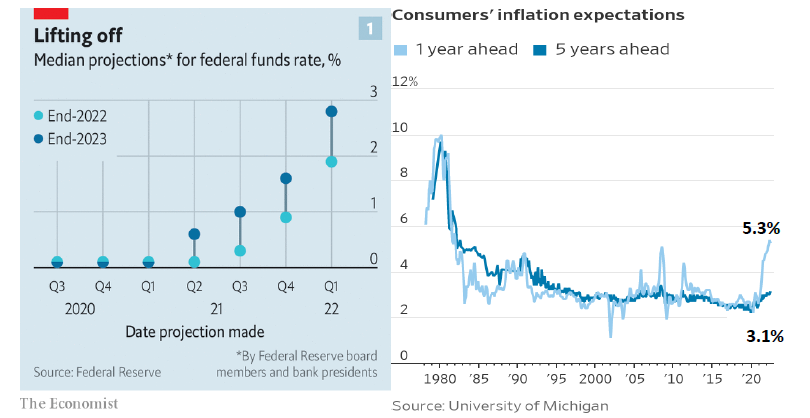
These predictions are not without some economic foundation. Since reaching an all-time
high last month, the average price for a gallon of gas in the U.S. is now about $4.50,
down from $4.84, while the prices for other commodities have declined significantly in
recent months. For example, copper prices just hit a two-year low and saw their largest
quarterly decline in over a decade. As the economy slows, recession or not, and short term
interest rates drop, future inflation rates should be tempered.
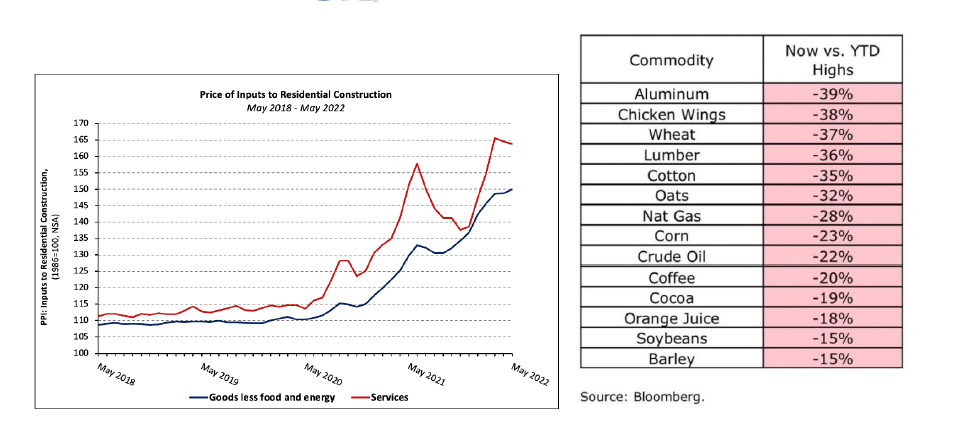
However, it will likely be some time before inflation approaches the Federal Reserve’s
two percent target, and while longer-term inflation may subside, one must wonder just
how much of the low inflation, low interest rate environment we have experienced for
the past several decades was simply a product of favorable demographics (i.e., slowing
population growth, reduced fertility rates), increased savings, globalization and the
shifts in production and outsourcing to places like India and China, automation,
Amazon, and aggressive fiscal policy.
And mortgage rates? What has been happening to real estate borrowing costs, and
what has been the impact?
To nobody’s surprise, these too have spiked, though thankfully they have come down
from recent highs. It is hard to imagine that 30-year, fixed mortgage rates averaged less
than 3.0% in 2021 (2.96%, to be precise) and now exceed more than 5.5%, nearly
doubling in six months, and up nearly one percent since the end of the first quarter.
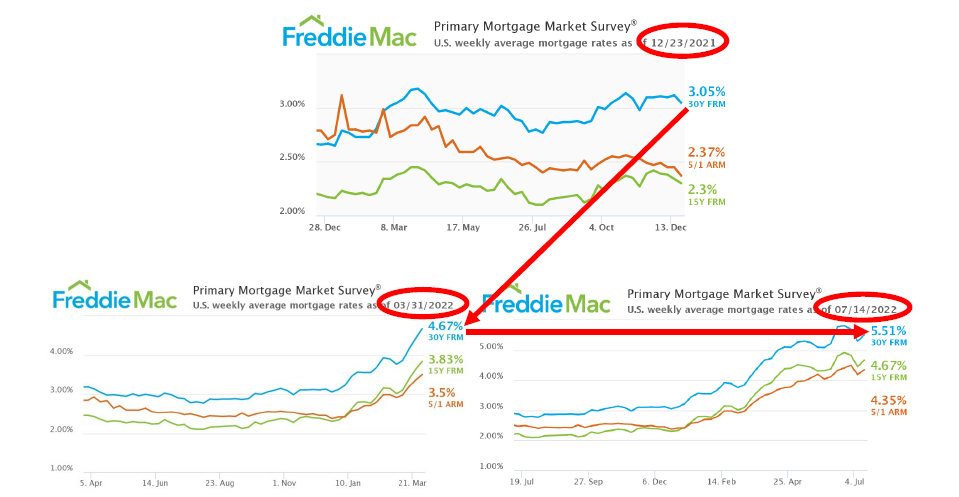
As a result, borrowing costs have increased significantly. The difference between a 30-
year fixed rate mortgage at 3% versus one at 6% translates to six figures or more in
additional (nominal) loan payments over time, depending on the price of the home and
size of the mortgage, of course:
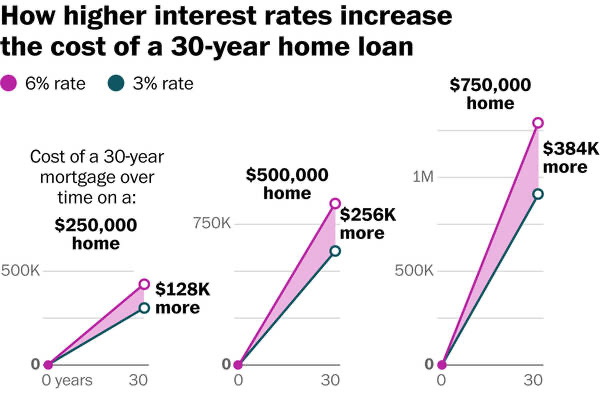
Again, to nobody’s surprise, mortgage applications for both new home purchases and
refinancings have plunged this year and the red-hot housing market has cooled, with
nationwide inventory of homes for sale up about 10% in recent weeks. Overall, in over
80% of the nation’s 400 largest housing markets, inventory levels have risen during the
past six weeks, although they remain below pre-pandemic levels.
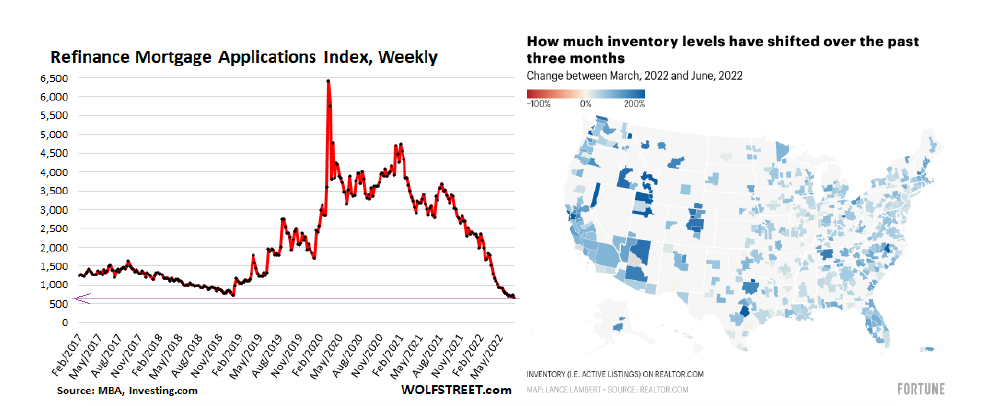
Finally, prospective homebuyers or those who have contracted with developers to
purchase new homes have been canceling those transactions in increasing numbers, but
these figures are not really alarming as cancellation rates are still less than what was
experienced at the start of the Covid-19 pandemic.
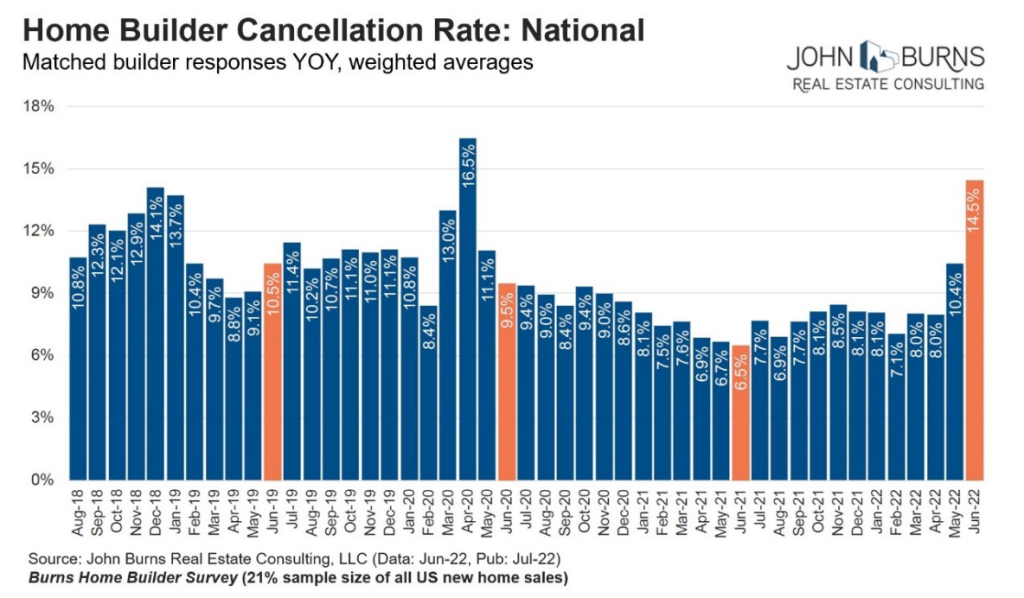
And housing prices? Have they dropped significantly in this environment of
substantially higher mortgage rates?
Well, this is where things get interesting and important. For the past several years,
prospective homebuyers have been fighting MMA-style for homes, like they were
chasing Beanie Babies, Cabbage Patch Dolls, or some other faddish holiday gift, rushing
into crowded Walmarts during Black Friday sales events. Buyers would send
compelling personalized letters and pictures of their families to accompany their offers,
believing that emotional connections might make the difference and compel a
homeowner to sell their home to them. Meanwhile, along with emotional pleas, these
potential home purchasers would foolishly agree to waive inspections and loan
contingencies, while accelerating closing dates, all caught up in the emotional frenzy.
However, while mortgage costs have increased and inventory levels risen (up almost
19% in June 2022 versus June of last year), home prices have not declined, at least not
broadly. That is, while demand has ebbed, supply increased, and prices in some
markets have softened, there was so much pent-up demand and liquidity awaiting
investment, such that these demand drivers coupled with an overall lack of supply and
persistent underbuilding, prices on closed transactions continue to rise overall. I don’t
believe this trend to be sustainable and prices will inevitably decline, at least in some
markets, especially those at the very high-end (e.g., San Jose, Seattle) or where prices
rose the most in recent years (e.g., Boise, Fresno).
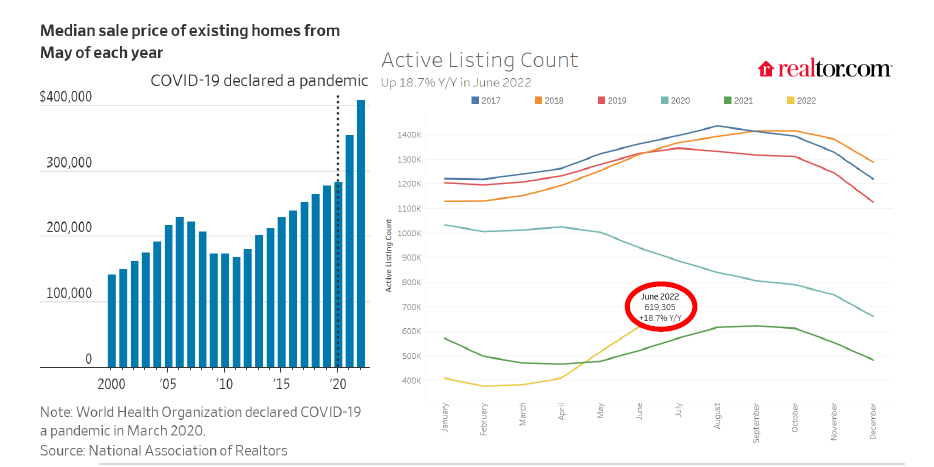
However, I expect home prices overall to drop only modestly, perhaps five to 10
percent, and in some markets, prices may not fall at all. Liquidity on the sidelines
remains high (M2 money supply stood at about $21.75 trillion at the end of May),
institutions are likely to continue their purchases of homes to rent (institutions
accounting for 20% of all home purchases in the last quarter of 2021), household
finances and debt levels remain in decent shape, banks remain adequately capitalized
and, having learned their lessons from the Great Financial Crisis, have significantly
tightened up their borrower underwriting (average FICO scores for homebuyers and
borrowers are about 50 points higher than what preceded the financial crisis).
Perhaps prospective sellers will merely see fewer offers, fewer family photos and
handwritten emotional pleas, and may simply receive more customary purchase offers,
you know, the kind which include due diligence provisions, contingency periods, and
closing dates. Frankly, I would be far more worried about the single-family housing
markets if I were Canadian, British, or French. In those markets, prices have risen far
above disposable income levels:
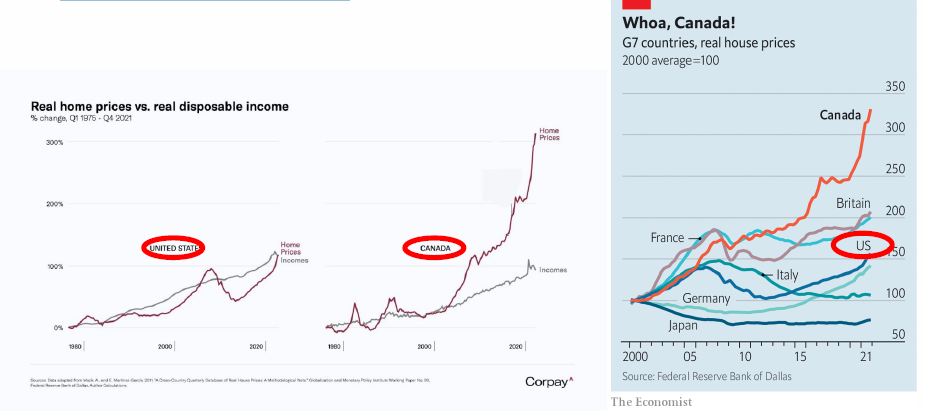
And multifamily rents and occupancies? How have apartments fared in this higher
interest and mortgage rate environment?
Well, in two words, “very well,” and being that I am big on pictures telling 1,000 words
(actually 1,500 now, due to inflation), here are three telling graphs:
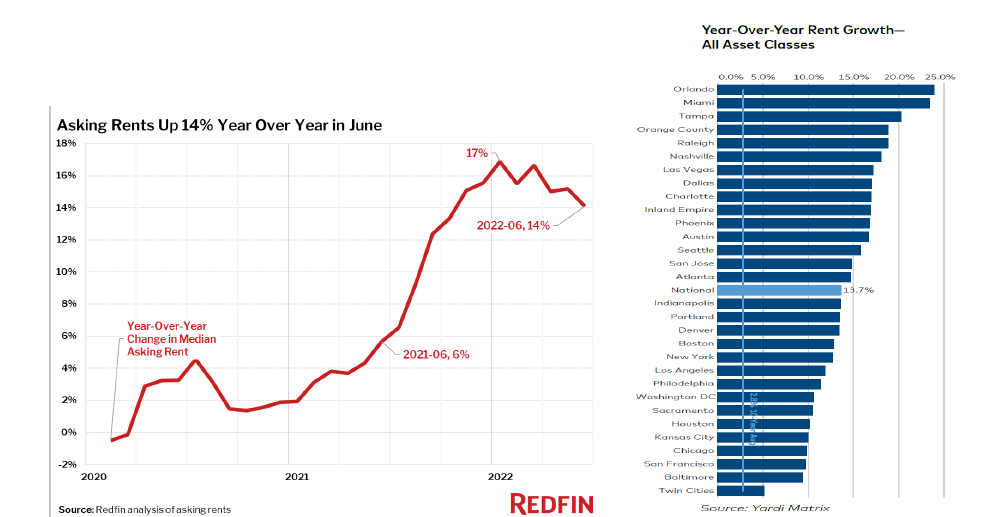
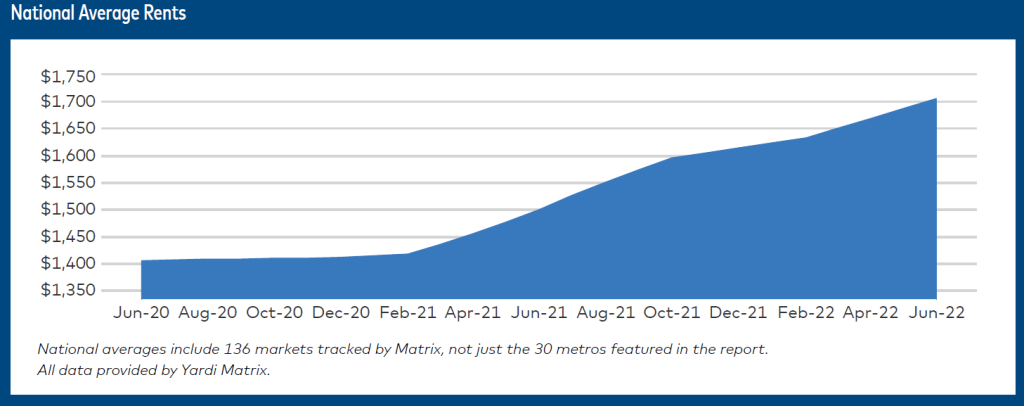
Meanwhile, occupancy rates nationally remain above 95%, consistent across asset quality and
location:
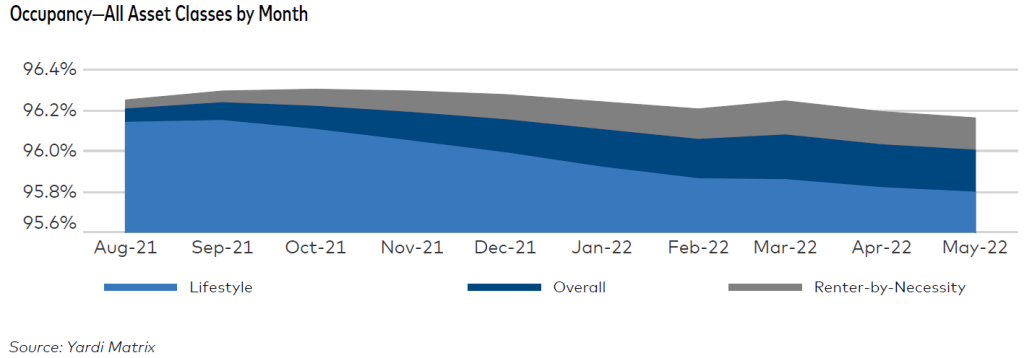
Through June, rents rose 14 to 15% nationally year-over-year, with the median listed
rent for an available apartment rising above $2,000 a month for the first time. Rents are
up more than 20% in several Florida markets (e.g., Orlando, Miami, and Tampa) and
over 15% in many markets (e.g., Austin, Phoenix, Nashville). Across the Clear Capital
portfolio, rents are up more than 10%, and higher in certain markets and in certain
assets. The only residential asset in the country with substantially declining rents is the
Arconia in New York City, due to the high number of violent crimes and unsolved
murders that continue to happen there (shameless plug for “Murders in the Building”
for you fans and Hulu subscribers).
While bidding wars have been a staple of hot single-family markets, these contests are
becoming more commonplace in the rental market. Real-estate agents from New York
to Chicago to Atlanta say they see more people than ever making offers above asking to
lease homes and apartments that they will never own. An increasing number of whitecollar
professionals—some of whom recently sold homes—are reluctant to buy or buy
again because of record-high home prices, those higher mortgage rates, and limited
supply of homes for sale. They are renting instead, helping to drive a frenzy for leased
properties of all kinds, and helping fuel the higher rent trend.
Look, the math is simple. If more folks – whether blue-collar or white, whether single or
married, whether childless or not – enter already hot markets where home prices and
mortgage rates remain high and where the supply of new homes for them to rent or buy
doesn’t substantially increase, rents really have nowhere to go, but up. It’s a simple
process. Mortgage rates go up, the ability for homebuyers to purchase homes decreases
(much higher down payments required along with higher ongoing servicing costs), and
there are more renters in the market who will remain renters for longer periods of time. In the face of static or modestly increasing supply, rents increase.
Yet, even as rents have risen, the cost of owning has increased even more such that gap
between the costs of owning and renting has widened:
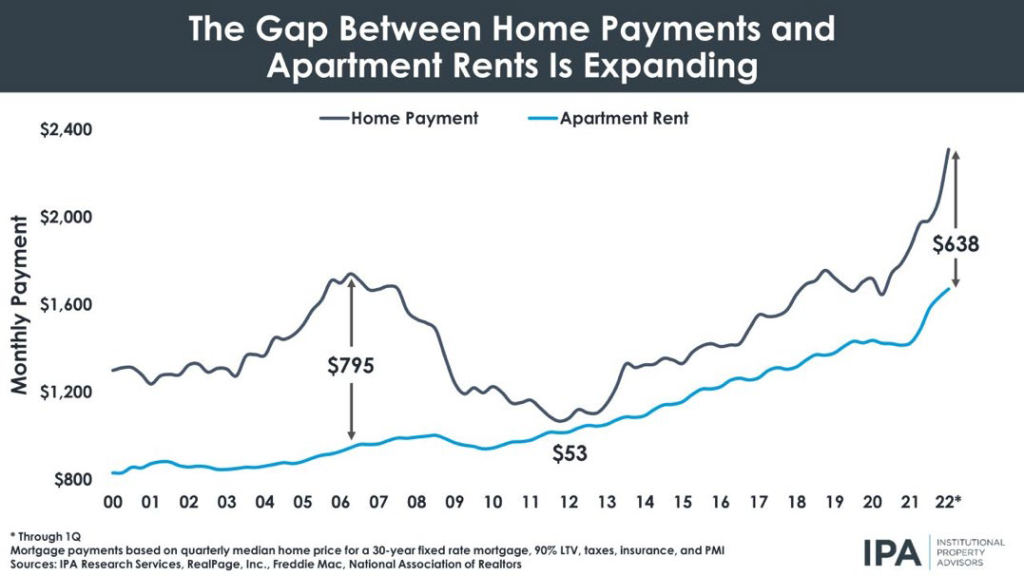
In many cities, home prices have increased so much that the time it takes to “break even” on a
home purchase (due to the higher upfront and ongoing mortgage costs) has widened, making
renting more attractive. For example, in Phoenix, where Clear Capital owns six assets, it now
takes over three years to break even on a median-price home purchase, up from about 2.5
years it took before the pandemic.
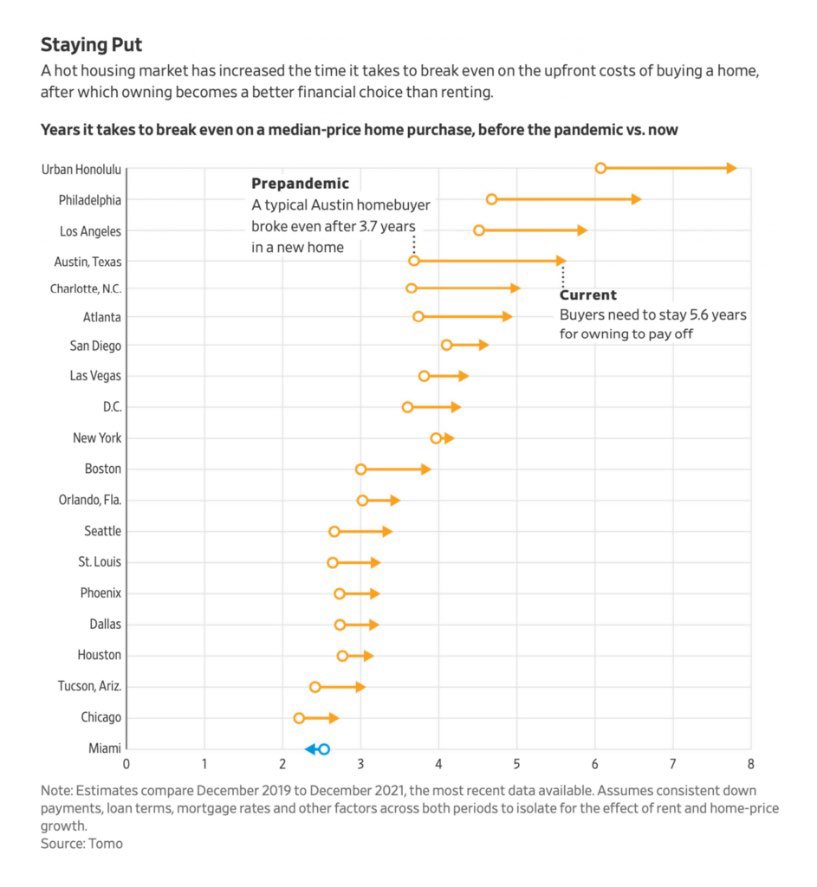
While builders were completing units at an unusually rapid rate in early 2022 (349,000
units per-year), about 1.2 times the pre-pandemic pace, according to the Joint Center for
Housing Studies at Harvard, the number of occupied apartments was rising more than
twice as quickly. For now, the housing market is bifurcating, with the market for
purchased homes slowing even as the rental market remains hot. Already, new home
construction has dropped sharply as borrowing costs climb, declining 14.4 percent in
May to the lowest rate in more than a year. Early data suggest that apartment
construction is also being impacted.
The caption from a recent WSJ article (late June) – “Worker Shortage Stymies
Construction” – highlighted one of the issues impeding the addition of new supply to
the constrained market. With unemployment already low (see additional discussion
below), homebuilders and contractors cannot identify and hire enough help, a challenge
exacerbated by the demand for labor tied to $600 billion in transportation-specific
funding earmarked in the $1.2 trillion bipartisan infrastructure bill passed last
November.
So, short-term residential housing data in this inflationary environment looks
favorable, but what are the prospects longer-term?
Because short-term trends can deceive, the question as to how investments in real estate
perform longer-term in the face of high inflation is an important one and was the
primary focus of our most recent monthly newsletter Clear Insights. Without repeating
all that was discussed there, I will simply provide a few data points and graphs that
were included in the newsletter in case you missed it.
The first demonstrates that single-family homes have provided positive real returns
(above inflation) since 1990.
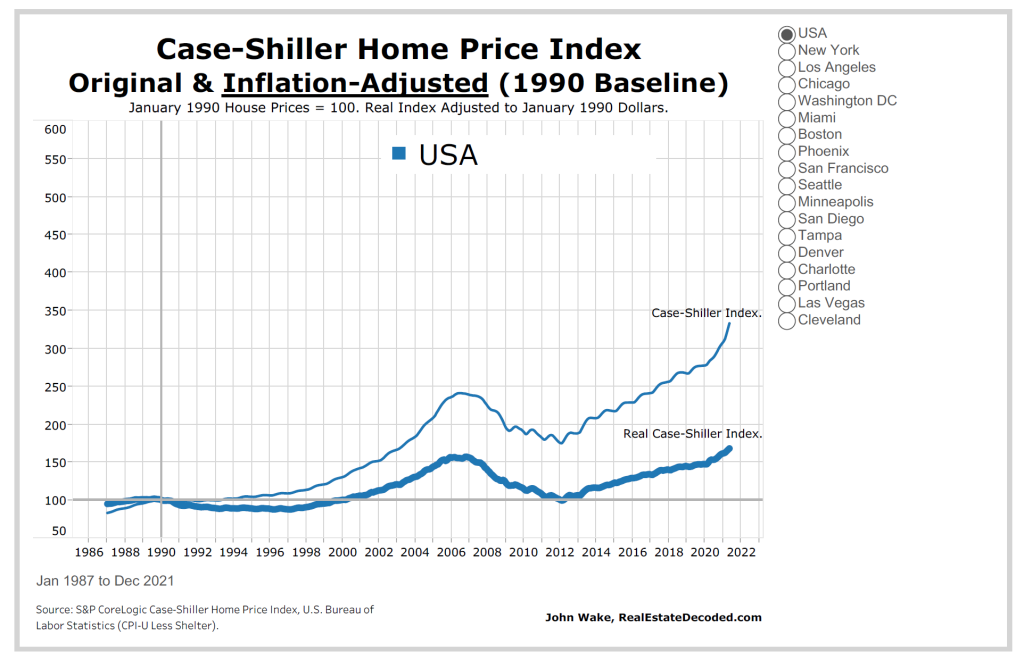
Meanwhile, during 1978 to 1981, a period some refer to as the “Great Inflation,” private
real estate exhibited the highest correlation to headline inflation of all major asset
classes. Private real estate also had the most favorable risk-adjusted return profile
during this period, as illustrated below.
Private Real Estate vs. Major Asset Class Classes
During the “Great Inflation”
(March 1978 – September 1981)1
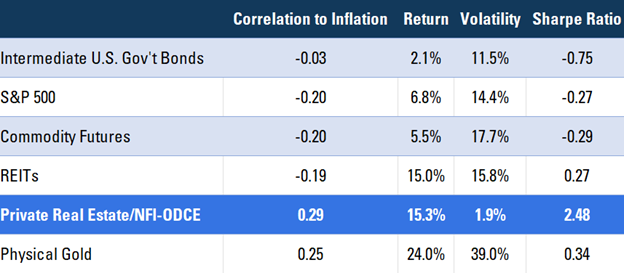
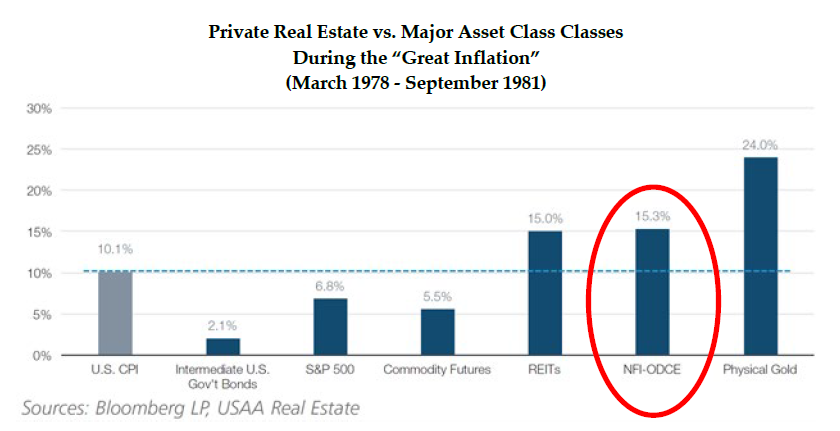
Finally, a paper published in November 2011, “Inflation and Real Estate Investments,”
written by Brad Case, Senior Vice President of NAREIT, and Susan Wachter, Professor
at Wharton, evaluated how publicly traded Real Estate Investment Trusts (REITs), the
most transparent of real estate investments, and came to a similar conclusion. In 1979,
when the consumer price index averaged 13.5%, total REIT returns 24.4%. During 1978
to 1980, when inflation averaged 11.6%, REITS’ total returns were 23.1%, and from 1974
to 1981, when the CPI averaged 9.3% per year, REITs returned 16.3% on average.
In theory, multifamily investments ought to perform well in an inflationary, high
interest-rate environment because of their shorter-term lease structures and higher
demand versus single-family homes, the latter of which become substantially less
affordable, as set forth above. In addition, in the face of greater uncertainty and risk,
prospective homebuyers prefer to sit on the sidelines and wait. After all, homebuying
activity may represent the single best barometer of consumer confidence, given it is
such a substantial and generally illiquid investment. And consumers are not exactly
brimming with confidence these days, which cannot come as any real surprise.
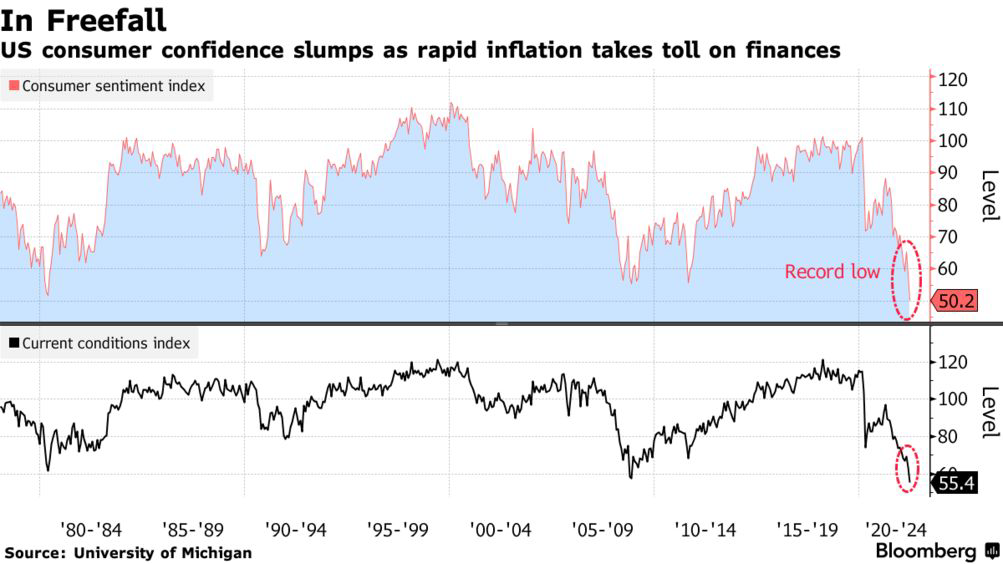
Even with the decline in confidence, consumers can carry on spending for a while, as
households across developed countries are still sitting on roughly $4 trillion of savings,
about 8% of GDP, mostly due to savings and government largesse during the
pandemic. To be clear it is not just the well-heeled who have increased their savings. I
read an interesting statistic recently that bank accounts of lower-income families were
65% higher than end of 2021 vs. 2019. Cynics will rightly point out that this statistic is
deceiving given the low absolute level of savings in this lower-income demographic, a reasonable criticism, but the broader point remains. Households are in better financial
shape than they were before the pandemic, all else equal.
Finally, with average hourly earnings for private-sector jobs increasing about five
percent in 2022 (the highest increase in years), these higher wages, while below inflation
and inadequate to shrink the mortgage cost-rental gap, will still allow for greater rental
payments. Moreover, I anticipate that even higher wages are forthcoming as employers
seek to fill open positions.
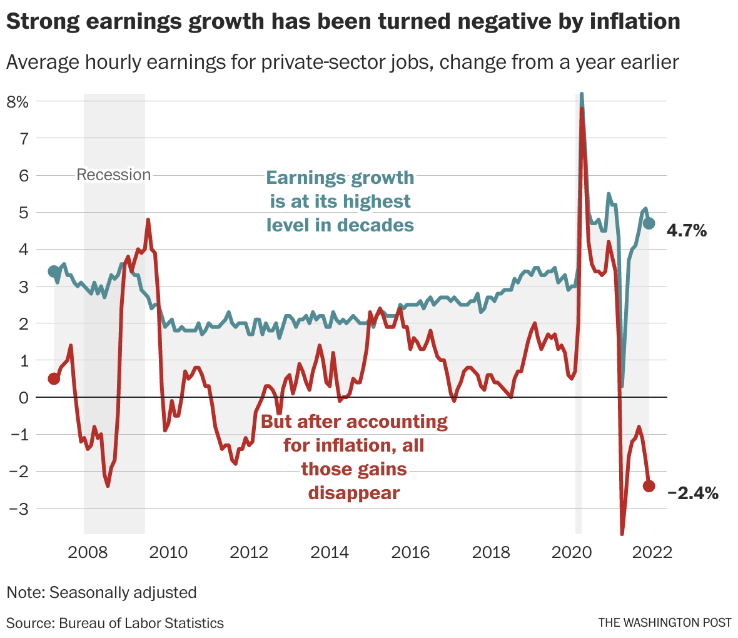
Meanwhile, there are a couple other issues and data points regarding housing
worth discussing
• “The Great Reshuffling” (not to be confused with the “Great Resignation”):
According to a new working paper from the National Bureau of Economic
Research, written by researchers from the Federal Reserve Bank of San Francisco
and the University of California, San Diego, home prices grew by nearly 24%
during the pandemic (December 2019 through November of last year), and the
study found that remote work accounted for 15.1% (or 60% on a relative basis) of
that growth. Cities like Austin, Boise, Phoenix, and San Diego saw some of the
biggest home prices increases in the country as a result.
According to the study, these remote-work friendly cities share three principal
features: i) A predominant industry that allows for remote work. Tech jobs, for
example, can often be performed remotely because they mostly involve work on
computers, of course; ii) Lower population density, where there is more space
and more affordable housing than in the biggest cities in the country. Because of
the high living costs in Manhattan, for example, having extra space for a home
office comes at a significant premium, even if it is economically doable. Lowerdensity
areas are more attractive for remote work; and iii) A warmer climate or
appealing lifestyle. I know this is a real shocker, but folks working remotely
would rather hear ocean waves, singing birds, and croaking toads (Jim Croce,
anyone?) than horns honking, trucks beeping, and sirens wailing.
• Increased amounts of home equity: According to the Federal Reserve,
Americans have more equity tied up in their homes than ever, nearly $28 trillion,
up over $4.5 trillion during just the first quarter of 2022. The hot housing markets
are largely responsible, of course, along with the high concentration and longterm
ownership of single-family homes by Baby Boomers who are reluctant or
unwilling to sell.
What is interesting is that a significant chunk of that increased equity has been
monetized through cash-out refinancings or HELOCs (home equity lines of
credit). There is no question that this additional liquidity found its way into the
markets and compelled increased economic activity. This source of economic
lighter fluid will all but dry up this year.
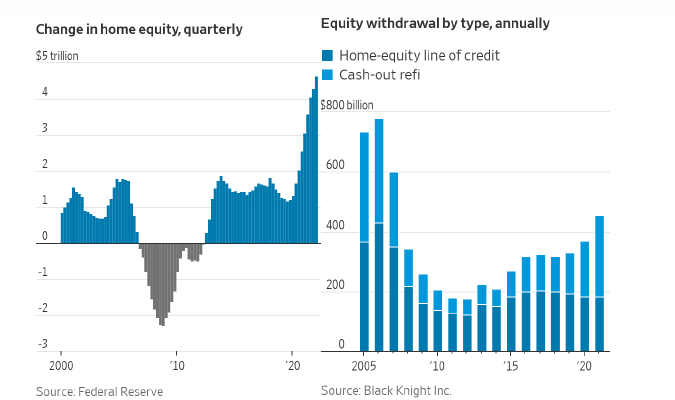
One bright spot is the job market, which remains surprisingly robust
Last week, the Bureau of Labor and Statistics indicated that non-farm payrolls increased
372,000 in June, well above the 268,000 estimate, maintaining the unemployment rate at
3.6%. Meanwhile, there are still over 11 million job openings, and anecdotally, many
businesses are having difficulty attracting and retaining help. Thus, although we may
experience a recession later this year or next, an economic downturn may not result in
significant job losses, net-net. While job losses may accelerate in some industries with
softening growth (e.g., tech, retail), other industries may very well see continued job
growth (e.g., travel and hospitality, construction).
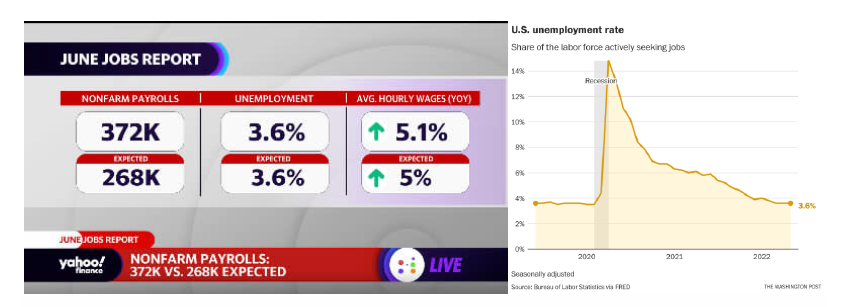
There were a couple of academic research papers that recently caught my eye, each
focusing on different issues involving labor and housing. The first was “Low-Income
Workers, Residential Location, and the Changing Commute in the United States;” and
the second, “Moving to Density: Half a Century of Housing Costs and Wage Premia.”
Imagine you are a janitor, an important but lower-level employee. Would you be better
off economically if you lived and worked in Huntsville, Alabama, or New York City?
What about if you are an MBA-trained investment banker or an attorney? How far
would (or should) such a worker commute to get to their job? How does the cost of
housing impact answers to these questions? Have workers stopped moving to the
highest-density, highest-productivity places in the country because of a decline in the
urban wage premium, or because the rent is too high? These two papers tackled these
sorts of questions, made interesting observations, and asked thought-provoking policy
questions.
Typically, lower-income workers lived closer to their work and had shorter commutes,
often working and residing in high-density urban cores. These non-college workers
earned “urban wage premiums,” benefitting from the proximity between their
residences and places of employment. Higher wage earners generally live in the
suburbs and make longer commutes to work, on average, but also benefitted from an
“urban wage premium” because employers would pay premia for employee skills. This
all seems intuitive.
However, the authors found that a growing number of lower-income workers have
relocated to the suburbs in search of more affordable housing, which increases
commute times. In some cases, work had indeed shifted from the urban cores to the
burbs, but more often than not, the cost of housing was a key factor in the relocation. In
short, the “urban wage premium” for unskilled labor is now an “urban wage penalty”
because housing costs are too high. This shift creates real challenges, especially for
businesses in urban cores that rely heavily on unskilled labor. How are such businesses
going to attract and retain needed workers, especially if reliable and efficient public
transportation isn’t available? Are employers going to need to provide and/or or
subsidize the cost of transportation to employees? Should the government subsidize
these efforts?
Looking forward, the lack of affordable housing and spotty public transportation in
many communities is going to create significant challenges to businesses in certain
urban cores that rely on unskilled labor, with such challenges only exacerbated by the
pandemic.
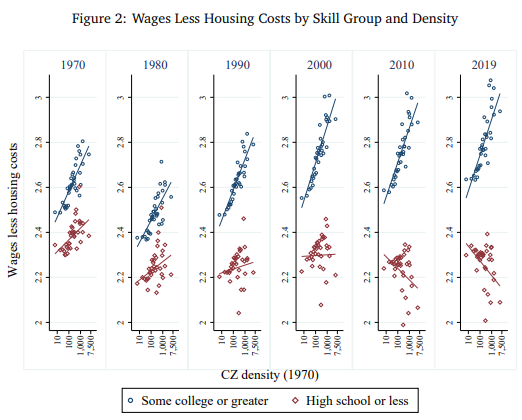
Perhaps one of the related issues is the disparity between average worker pay and
management. In another article I recently read, I was not at all surprised to learn that
even with the recent increase in worker wages, which are up about six percent this past
year, it would take 186 years for the average worker at a publicly traded company to
match what a typical CEO earns. 186 years, about how long it has been since my
beloved Bruins appeared in a meaningful Bowl game.
In 2021, the typical compensation for the CEO of an S&P 500 company was up more
than 17%, to a median of $14.5 million. Obviously, some executive compensation
packages are eye-popping. The CEO of Expedia Group took down a cool $296.2 million
last year, while Jamie Dimon of JP Morgan Chase earned a mere $84.4 million. In
comparison, the median Walmart Associate made $25,335 last year. I suppose it is no
wonder that workers are making increased efforts to unionize, with employees of
Amazon and Starbucks garnering the most attention in recent years.
While the second quarter was reasonably quiet in terms of new housing regulations,
that would change significantly if John Oliver had his way,
Some of you may have seen the John Oliver segment from late June where he focused
on rising rents and housing affordability and argued that housing should be a federally
funded right and rent control broadly expanded. Landlords were essentially portrayed
as greedy capitalists raising rents mercilessly at the expense of the working class. You
can check it out here, if you are so inclined:
https://www.bing.com/videos/search?q=john+oliver+rent+control+you+tube&docid=608052449075874575
&mid=FF11ADDEF511F1CDADEBFF11ADDEF511F1CDADEB&view=detail&FORM=VIRE
Now, as much as I like a lot of John Oliver’s schtick and enjoy thoughtful comedy and
commentary as much as anyone, I was profoundly disappointed at how superficial,
incomplete, and fundamentally flawed his analysis and conclusions were. I realize that
Mr. Oliver hosts a comedy show, and as a comedian, he might not have all his facts
right or understand all the nuances on a topic he covers. But he barely touched upon
issues surrounding the supply of housing, excessive regulation, byzantine building
codes, and public opposition to almost any proposed project, especially those with high
density. It is what an experienced litigator feels when watching an episode of “Law and
Order.”
In one obvious error, Oliver rails on new construction, complaining that it is only
directed to high-end, white-collar renters, and that this new supply does not help the
working class and their need for housing. On the macro-point, of course he is right. We
need more darn housing and more affordable housing. But his analysis is flatly
incorrect and way too shallow. All else equal, more housing supply means more
available housing and lower overall rents, period. Additional supply of higher-end
units will allow some white-collar renters to relocate from their Class B units, making
them available to more cash-strapped renters.
He fails to mention that affordable housing projects require government largesse, which
is not only limited, but comes at a price. Complying with all the rules and regulations
tied to whatever government largesse is received (i.e., need to use unionized labor,
comply with stricter environmental regulations) substantially increases the cost to
construct affordable housing projects. More than half a dozen affordable projects here in
California are costing more than $1 million per unit, three times what it costs to build a
market-based unit.
In another glaring oversight, he was wrong on rent stabilization, claiming that it only
exists in California and Oregon. He failed to mention New York and its two types of
programs: rent control and rent stabilization. He failed to mention that some form of
rent control exists in other jurisdictions, from Boston to Minneapolis to Washington
D.C. Finally, he claimed that many landlords refuse to accept Section 8 vouchers, which
is true, but misleading. In California, for example, a landlord may not discriminate
against a prospective Section 8 tenant and may not reject them out of hand. If a unit is
available and a Section 8 tenant comes along and otherwise qualifies as a renter, the
landlord has to rent to that Section 8 tenant.
Finally, this quarter’s winner for least effective public policy decision to address
housing affordability goes to a regular nominee for the award, the Los Angeles City
Council, which voted 12-0 to purchase and municipalize a 124-unit property just north
of downtown and Chinatown to prevent the current landlord from increasing rents to
market. On the one hand, I applaud the landlord for creating enough of an uproar to
compel the City to purchase the property from him at its fair value. On the other, I am
none too thrilled that taxpayer funds (to which I am a contributor) are being used in
such an ineffective way, one that will make absolutely no meaningful inroads to the
housing affordability challenges the City faces.
Before we put another quarterly memo to bed, I should mention a few other events
impacting financial markets and the economy
• Cryptocurrencies and other speculative investments (e.g., Meme stocks,
SPACS) have their comeuppance. This quarter saw the implosion of the
cryptocurrency market, with the total capitalization of Bitcoin and its siblings
losing almost $2 trillion (over 60%) in value, and frankly, as much as I hate for
anyone to lose money, if not their life savings, it has been long overdue. As I
discussed in one of my Focus on Facts podcast episodes last year (still available
on Spotify and Apple!), “Bitcoin: Currency of the Future or Just Another
Bubble?,” I could never discern a compelling need for cryptocurrencies, at least
for non-illicit transactions and honest transactors. Deregulated markets coupled
with human propensity for greed are a toxic cocktail. Other speculative
investments (read: meme stocks, SPACs) took it on the chin in the second
quarter.
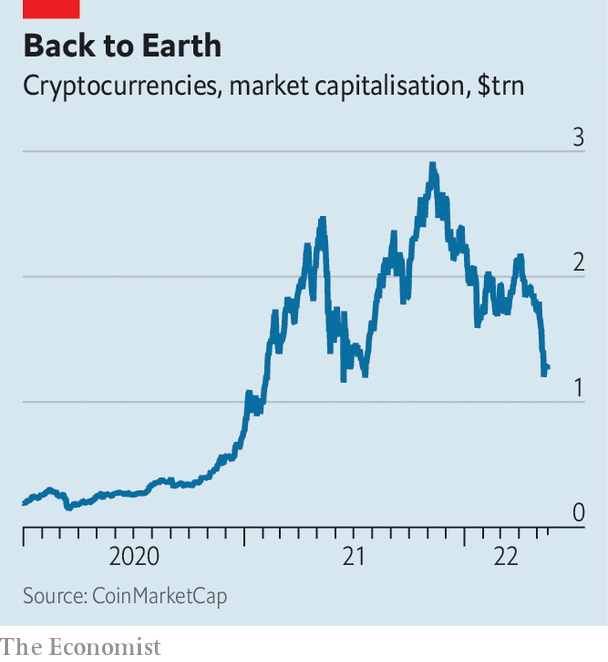
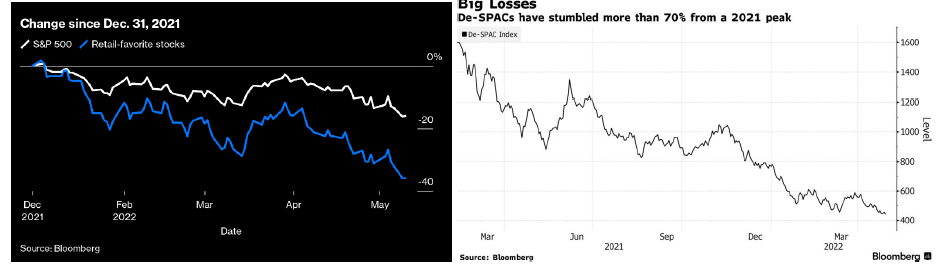
Several crypto exchanges, dealers, asset managers, and lenders ironically now
occupy crypts, having filed Chapter 11 during just the past couple of months –
Voyager Digital, Three Arrows, Celsius – while a number of “stablecoins” (can
you say “oxymoron”?) proved anything but (e.g., Terra/Luna). With more crypto
firms becoming insolvent and filing for bankruptcy, it is now clear that many
customers (gamblers?) will face massive losses, and another generation will have
learned a painful lesson and the difference between investing and speculating,
and how silly graphics like this, which seem polished, are nothing more than
graphical artistry and a paragon of “form over substance.”
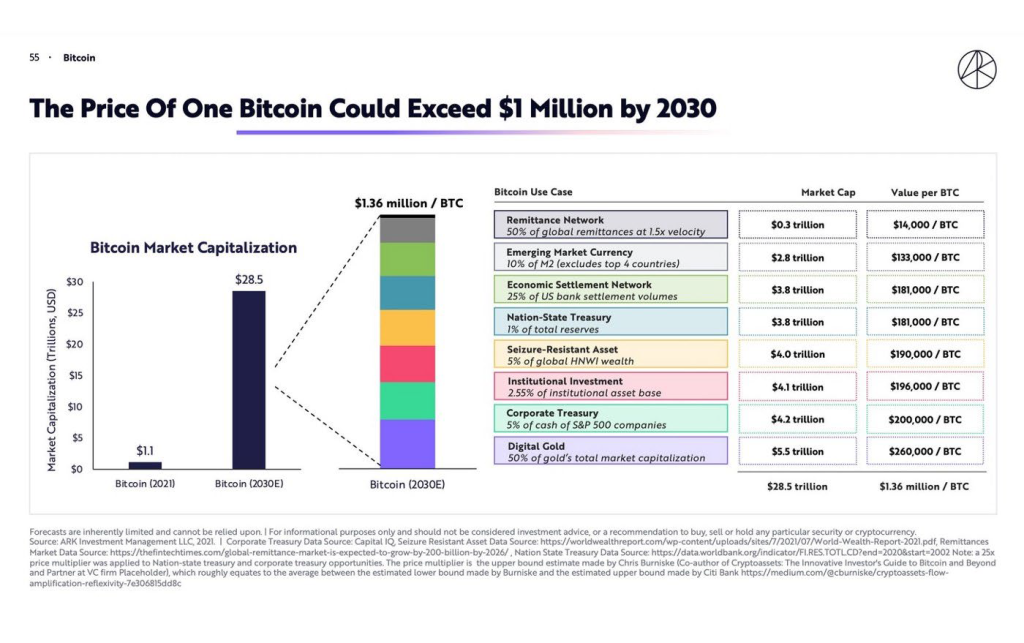
• Strength in the U.S. Dollar: Perhaps not completely untethered (pun intended)
from the collapse in the cryptocurrency market, the dollar is up by over 7%
during the last twelve months, versus a broad basket of currencies, and is now
trading at par (1:1) with the Euro for the first time in 20 years. Slowing economic
growth, exacerbated by an energy crisis brought on by the conflict in Ukraine
and high inflation (the EU’s inflation rate is close to our own), has seriously
impaired the value of the Euro. This is good news for those of you intending to
travel to Europe this year but not so great news for global economic stability and
financial markets generally.
Finally, history tells us that markets cannot be timed, with peaks and troughs known
only in hindsight. Therefore, most investors should simply stay the course, effectively
managing leverage and focusing on investing in assets that should do well in
inflationary environments.
It is hard to sugarcoat the news and challenges that the second quarter brought, making
it no easy task to watch or read the headlines: higher inflation and mortgage rates,
declining stock markets, geopolitical conflicts, increasing threat of recession, gun
violence, another virulent variant of Covid, the crash in crypto and other speculative
assets, sobering revelations from the January 6th Commission, food shortages globally
and a baby formula shortage closer to home. At this point, newscasts should start their
broadcasts with health warnings like those for pharmaceutical products: “This news
report may cause gastrointestinal distress, increases in blood pressure, and difficulty
with breathing.”
However, as I mentioned in our last quarterly memo, markets and investor sentiment
are fickle things, and it is a fool’s errand to chase what’s hot and sell what’s cold in an
effort to time peaks and troughs in asset values. If pictures tell 1,000 (I mean, 1,500, due
to inflation) words in this regard, these have to do the trick:
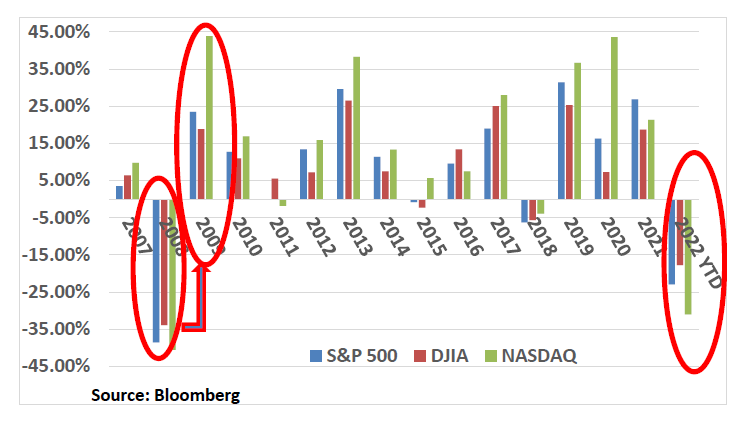
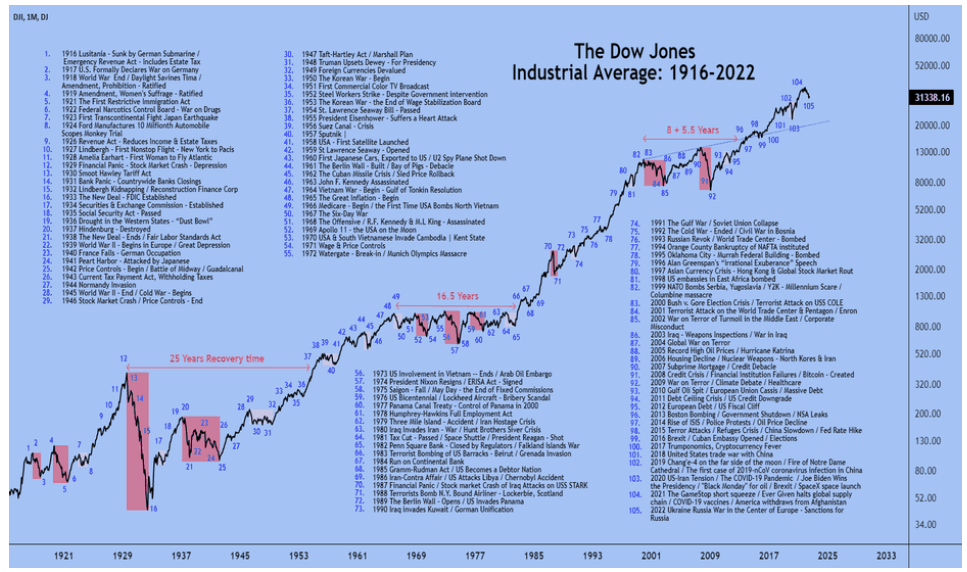
I want you to imagine that you are back in 2009, and reliving the Great Recession, when
equity prices fell nearly 40%. What was your mindset then? How eager were you to
make new investments at that time? Were any of us predicting that the market would
bounce back the following year? Well, it did, and the next decade was incredibly
favorable for stock prices. How long after the Great Financial Crisis ended were you
making investments without even giving any thought to what had happened not much
earlier? 2011? 2012? Most likely it was after the markets had already recaptured much of
their losses.
Fast forward to today, when the S&P 500 and NASDAQ are down approximately 19%
and 27%, respectively, during just the first half of 2022. I imagine many of us are
nervous, hoarding cash, and awaiting markets and asset prices to stabilize before
jumping back in. Well, if history is any indicator, by the time that happens, you will
either be late to the party or will have missed it entirely. Obviously, I cannot predict
that equity markets will bounce back during the second half of the year or in 2023, but I
sure wouldn’t bet against it. Rainbow, sparkle, and sunshine are always around the
proverbial corner. Just ask Paris Hilton if you don’t believe me.
Meanwhile, Clear Capital continues to execute, maximizing returns on its existing
portfolio, and pursuing acquisitions we find attractive, including Aspire West Phoenix,
an 180-unit project built in 1977, with attractive fundamentals and projected returns.
Details about the offering can be found here:
https://investors.clearcapllc.com/portal/offering/8fedb2db-5fc7-47ff-a598-c881f6e80537.
We will close our fundraising for this asset in less than two weeks, so let us know if you
might be interested or want to learn more. We anticipate refinancing and/or selling a
handful of assets before the end of the year, so stay tuned for additional news on that
front.
And lastly, because I do want to end a droll quarter and lengthy newsletter with some
Paris Hilton inspired positivity, I will turn to my go-to therapy in tough times and
favorite life advisors and philosophers, Calvin & Hobbes, who never disappoint.

With that, the entire Clear Capital team and I pass along our very best wishes to you
and yours, and hope you make the most of your remaining summers, just like Calvin
and his stuffed tiger companion.
We thank you for your continued engagement and support of our firm and its
endeavors, including our latest opportunity, Aspire West Phoenix. And, as always, I
want to express a special round of thanks to the Clear Capital Team, who continue to go
above and beyond for our clients, colleagues, and partners.
Best,
Eric Sussman
Managing Partner
“Change is the law of life. Those who look only to the past or the present are certain to miss the future.”
-John F. Kennedy
“Education is the most powerful weapon we can use to change the world.”
– Nelson Mandela
As I practiced my karaoke skills last week while listening to Sirius’ radio’s ‘70’s on 7’ and badly butchering Blood, Sweat, & Tears’ hit song, “Spinning Wheel” (“what goooes up, muuust come down, spinning wheel got to go round”), before moving on to Bloomberg Radio, where I was met with headlines like “record oil prices,” “highest inflation in 50 years,” “fears of recession and stagflation,” “a new Cold War,” and “waning stock indices,” I wondered whether I had become trapped in a Twilight Zone episode where my satellite radio had somehow transported me back in time.
But then news about Elon Musk’s offer to buy Twitter, China’s temporary closure of Shanghai in an effort to stymy the spread of Covid, and reference to California cannabis taxes and the resulting black market snapped me out of my daydream, reminding me that I was still firmly ensconced in 2022 and simply experiencing that old Twain adage that “history doesn’t repeat itself, but merely rhymes.”
So, with my brief imagined trip back to the 1970’s complete, let’s cut to the brass tacks from the first quarter of 2022, one I am glad to see relegated to the history books. Despite good news about the job market and an economy that saw half a million jobs added in March, a drop in the unemployment rate to 3.6%, the confirmation of the first Black female Justice to the U.S. Supreme Court, and my parents turning 90 and 84, respectively, there were more than a handful of sobering headlines during the quarter.
During the Academy Awards a few short weeks ago and the slap heard ‘round the world, you may have missed one auspicious award category, “Worst News of the Quarter,” the nominees for which were as follows…:
• Russia’s unprovoked invasion of Ukraine, an obvious tragedy and travesty that history will remember as such
• The decline in U.S. equity prices, ushering in the worst quarter for stocks in two years, with the S&P 500, Dow Jones Industrial Average, and NASDAQ down 4.6, 4.9, 9.1%, respectively (and in a newsflash, the S&P is down 8.42% and the NASDAQ 15.67%, as of (a less than) Good Friday)
• The highest inflation seen in a generation (40 or 50 years, but who’s counting?) and the higher interest and mortgage rates it has engendered, along with Dollar Tree substantively becoming “$1.25 Tree”
• Record-high (nominal) gas prices (which seem to have had no effect on traffic)
• Persistent supply chain woes, exacerbated by sanctions on Russia, the shutdown of Shanghai as China experiences the limits of its “no Covid” policy, and Texas’ Governor Abbott slowing down all traffic crossing the Texas-Mexican border to address supposed “security concerns,” and last, but not least,
• The release of yet another variant of Covid, an unwelcome Omicron sibling
In the “honorable mention” category for “worst news of the quarter,” I would include my beloved Bruins’ loss in the NCAA Tournament to North Carolina, the ending of this season’s Bachelor that left two women in loving suspense at the final rose ceremony, and headlines about some rabid fox on the loose on Capitol Hill that ended up biting at least one member of Congress. I realize many may think the latter story might make you wonder why it had to be only one member of Congress, but I will leave that debate for another day.
Without picking an Oscar winner (loser?), three pictures about the equity markets, inflation, and interest/mortgage rates, respectively, tell a thousand sobering words about the most recent quarter, and a tad beyond:
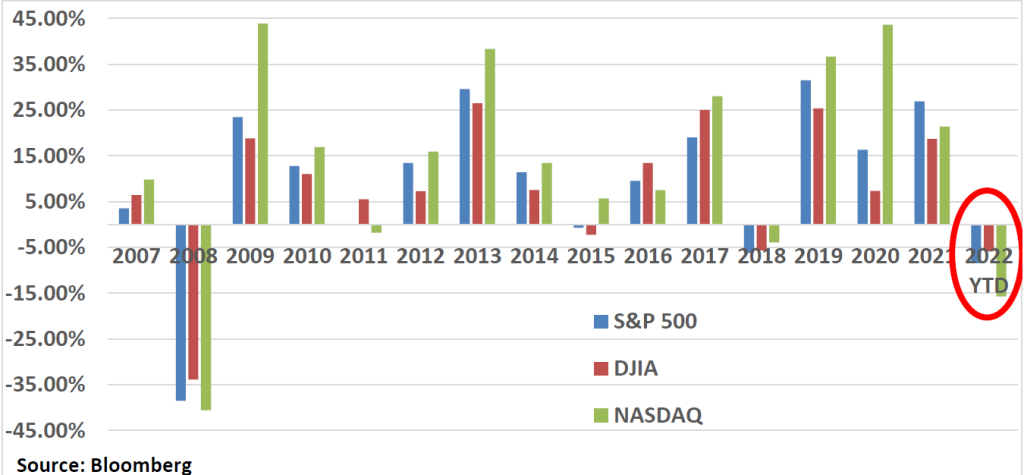
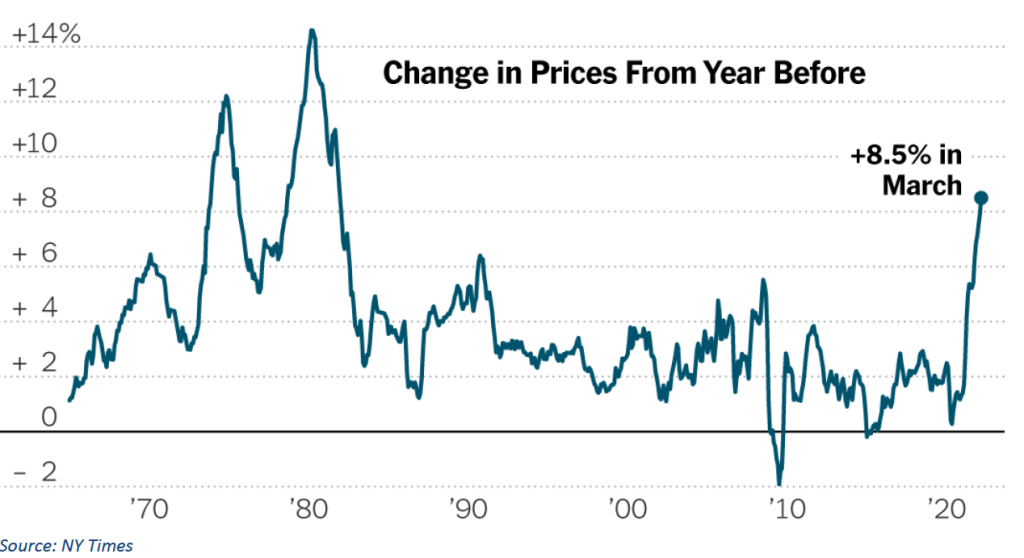
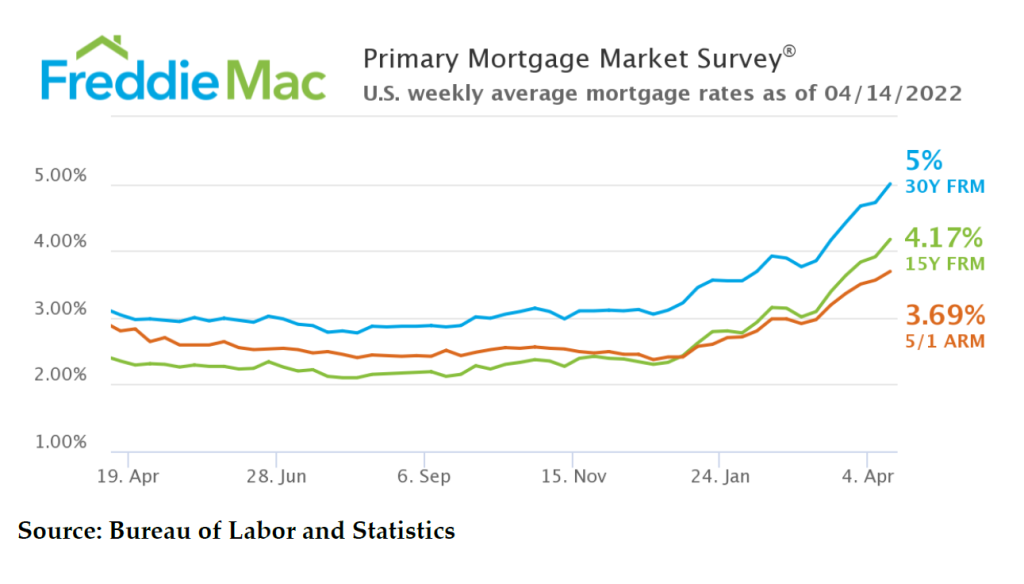
Now, the trillion-dollar question is what’s next? With so many macroeconomic challenges, are we inevitably headed into a recession? On the one hand, if I were to refer to my Easy-Bake Oven™ recession recipe, it might read something like this:
- One quart of higher interest rates
- Three cups of Federal Reserve tightening and balance sheet “reductions”
- Two tablespoons of broad consumer-based inflation
- A teaspoon of higher oil and commodity costs
- A pinch of geopolitical tension
- A dash of bubble-like trading action in speculative assets
Over the past 75 years, every time inflation has exceeded four percent and unemployment has gone below five percent, the U.S. economy has experienced a recession within two years. Today the U.S. inflation rate (CPI-U) exceeds eight percent and unemployment sits at 3.6%. Add in the boom in commodity prices, the Fed’s decision to increase interest rates and shrink its balance sheet, the war in Ukraine, and the flattened yield curve (note the very modest difference between yields on two- and 10-year Treasuries) and you would think a recession has to be in the cards. And that perspective is certainly not without merit.
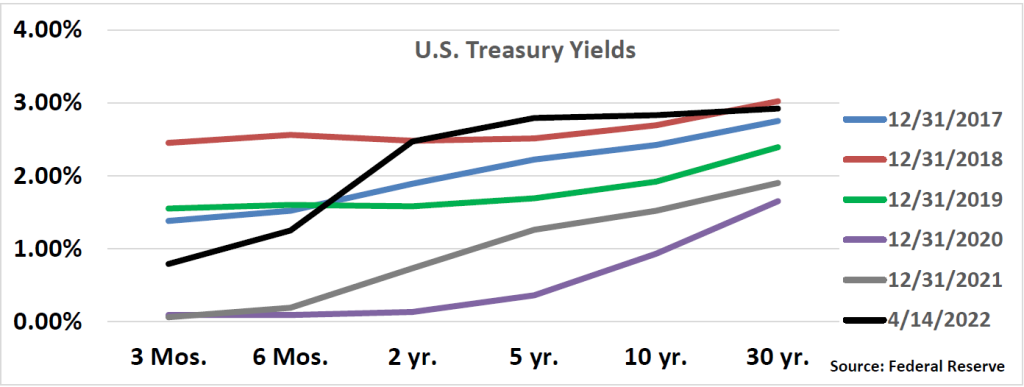
On the other hand (economic pundits must always have that second hand, if not a third), extraordinary liquidity (M2 money supply of some $22 trillion), near record lows of household debt service payments as a percentage of disposable personal income, and near record highs of real median household income (see graphs below), all combined with pent-up post-Covid demand, create plenty of economic tailwinds. The data is conflicting and confounding to say the least.
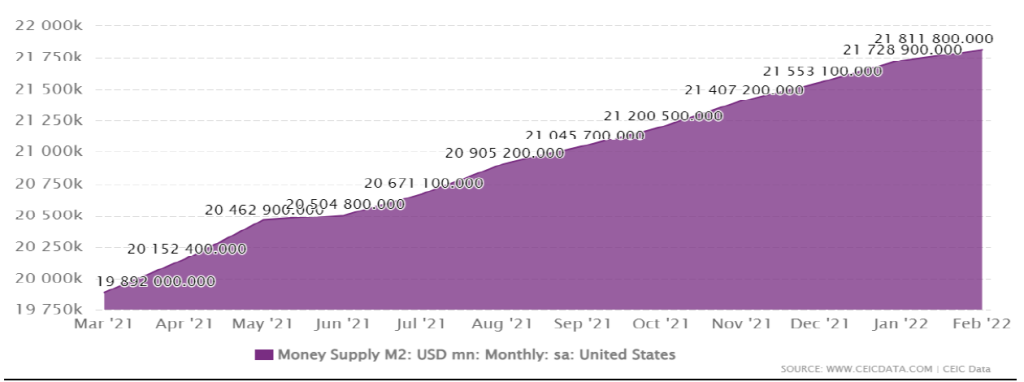
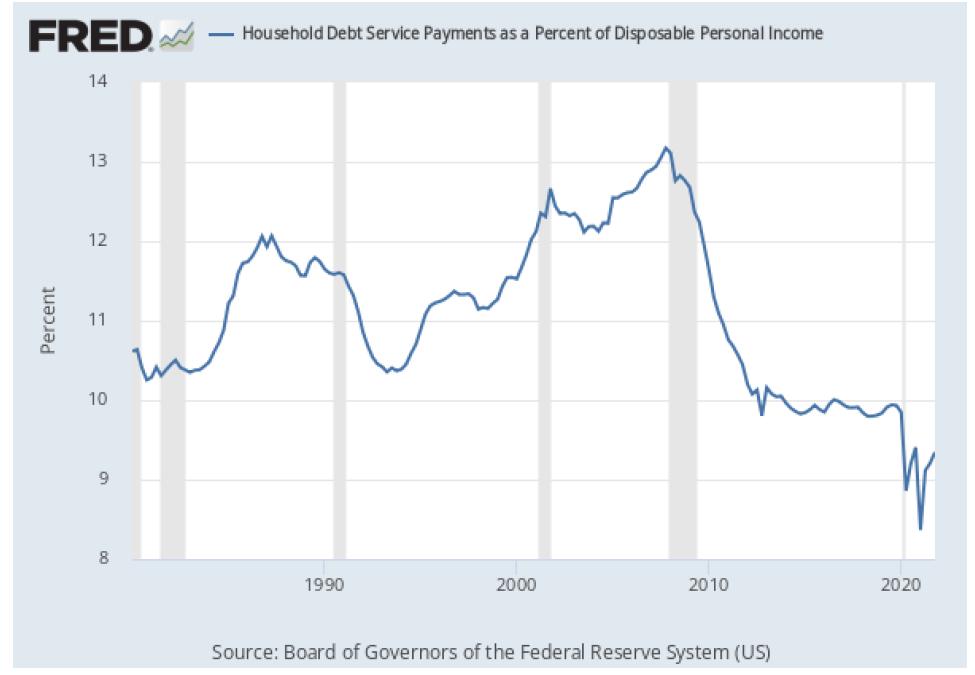
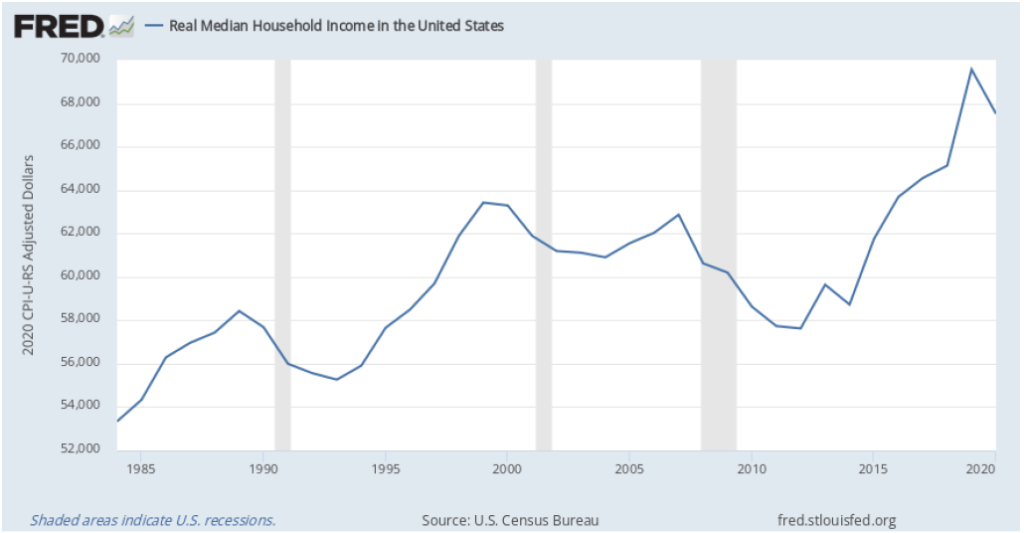
Meanwhile, anecdotally I have witnessed increases in traffic of late: on LA’s freeways (higher gas prices be damned), in LAX and Atlanta airports (Delta was offering $700 to seven passengers on an overbooked flight I recently took), and at the shopping destinations I frequent (yes, Costco, of course). In addition, geopolitical tensions, from Taiwan to Hong Kong, to Ukraine to Latin America, while creating a material drag on global GDP, will create additional capital flows to the U.S. as investors seek safe(r) havens in which to place their capital. Recent trends in the value of the U.S. dollar speak directly to this reality.
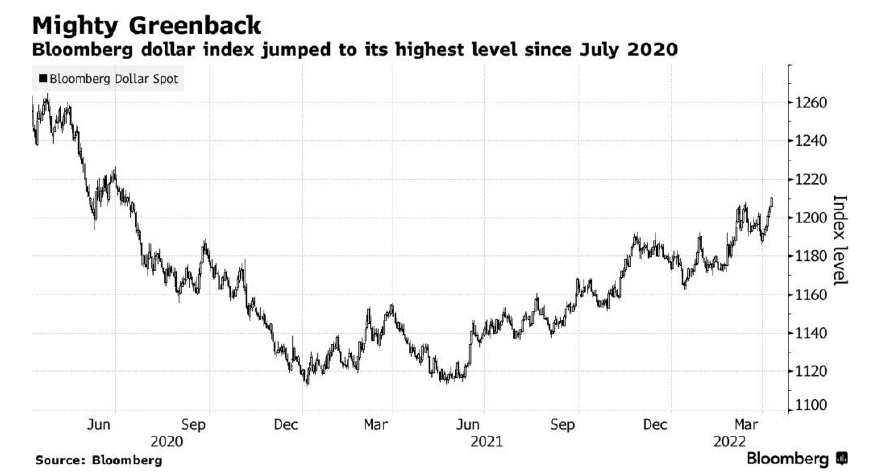
And remember that the likes of Blackstone and Trammel Crow, which just closed a new fund (Crow Holdings Development Opportunities Fund I, L.P.), along with their private equity compatriots, have raised significant capital (read: billions) in recent months that they will need to deploy. To wit, in February, Blackstone acquired Preferred Apartment Communities, Inc. in a $5.8 billion deal. Preferred owns about 12,000 units in the southeast, as well as a smattering of other commercial assets. I am sure Blackstone will continue its shopping spree like it’s Black Friday given its sizable war chest.
In short, a Vegas bookie would have his or her hands full trying to handicap the odds that a recession is on its way in the next year or two. At this point, I find myself in the “no recession” camp, but that perspective may change after first quarter earnings season is over or if Will Smith slaps me to my senses. For my money, the biggest question marks remain inflation and how consumers and investors react to the persistently higher prices they are likely to experience, from grocery stores to the gas pumps to cars; what the Fed does and how it tries to thread the inflation-recessionary needle; and, finally, what happens with all that capital sitting on the sidelines.
I continue to hoard popcorn as I evaluate all the data. And for the record, popcorn prices at Disneyworld are up from $12 to $13 a bucket this year….and I blame Russia, the Fed, and the late Orville Redenbacher. And what about real estate? Will higher interest rates necessarily mark the end of the hot housing market?
To say that the residential real estate market has been hot would be an understatement. I can almost hear that annoying voice from the 1980’s Crazy Eddie commercials shouting, “These Prices are Insane!” as rents and housing prices continued their upward marches in the first quarter. Through the first three months of the year, 2022’s national multifamily rent growth is outpacing 2021, according to at least one source (Zumper’s National Rent Report). According to Zumper, the national median rent for one-bedroom apartments reached an all-time high of $1,400, representing a 2.5 percent increase for the year so far, ahead of the 1.9 percent growth experienced at this time last year, while year-over-year increases reached double-digits in market after market. Markets like Miami, Austin, and Phoenix continue to lead the rental growth pack, but even markets like Detroit saw double-digit rent increases during the past year. Just two of the fifty most-populous metro areas saw rents fall from a year earlier. Rents declined three percent and two percent in Milwaukee and Kansas City, respectively. Again, a picture tells the story, in all its rainbowed glory:
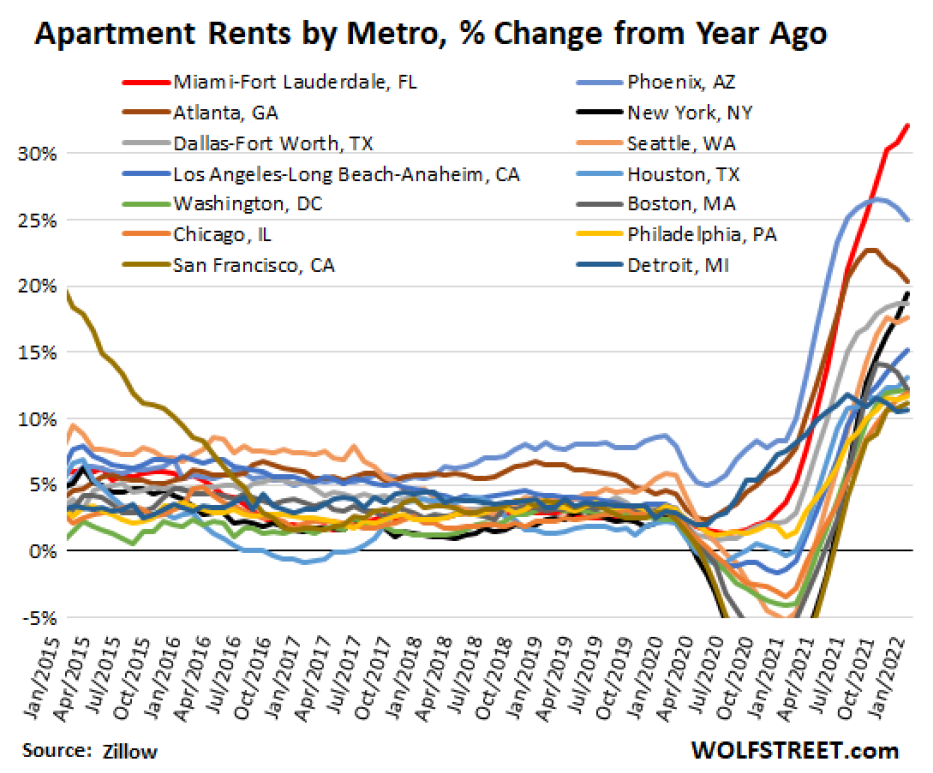
And single-family homes? It, too, is the “same old song,” as the Four Tops once sang (that would be ‘60’s on 6’ on your Sirius/XM dials for you satellite radio subscribers), with prices up sharply thus far in 2022, and year-over-year. The median sales price for a home here in Los Angeles rose by 11.2%, from $850,000 in February 2021 to $945,000 in February 2022. Nationally, the median listing price was 12.9% higher in February compared to last year.
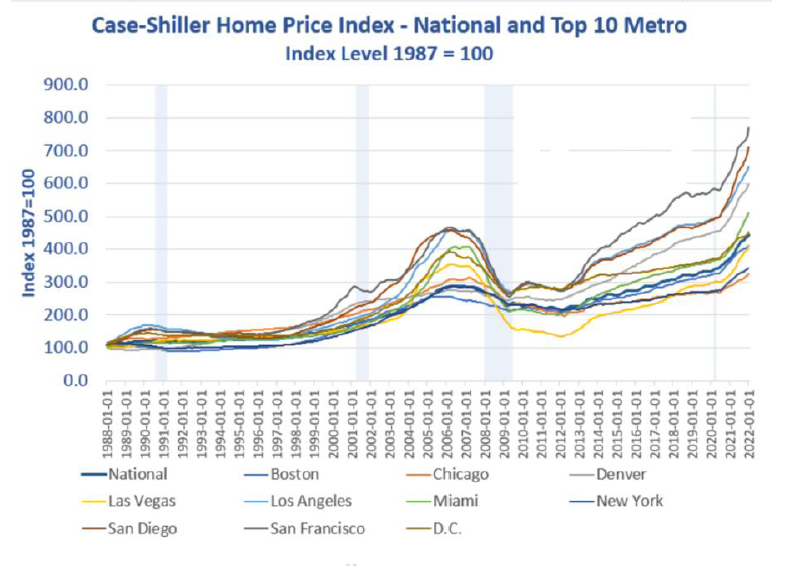
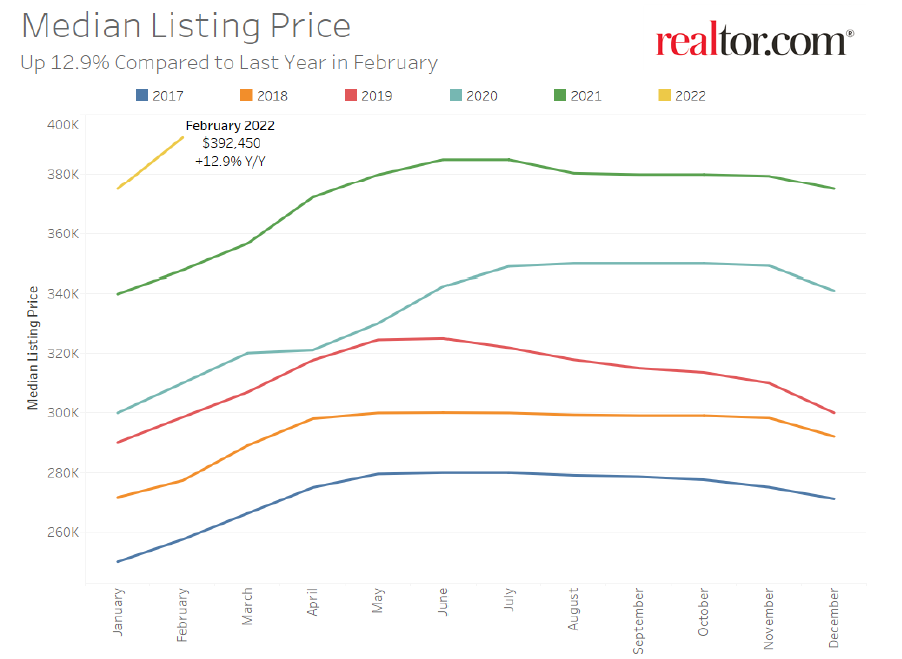
Meanwhile, the supply of homes for sales remains tight, with homes available for sale in Los Angeles and nationally down 41.3% and 24.5%, respectively, year-over-year (through February). It is no wonder that negotiations between prospective homebuyers and sellers are looking more like MMA bouts than normal negotiations. In any case, the multifamily market remains a significant beneficiary of these single-family trends and realities.
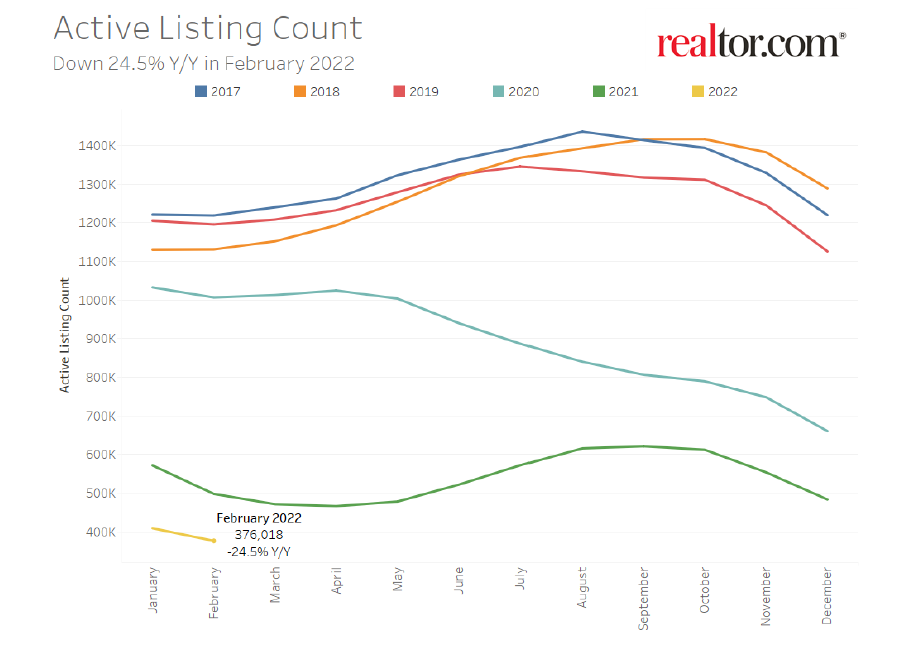
So, what now? Not surprisingly, the typical narrative is that higher mortgage rates will temper the housing market, and there is no question that they will to some degree, as some first-time or more cash-constrained homebuyers become shut out of the market. However, several factors make the housing market more robust and resistant to broad-based declines than in prior cycles. One, consumer and household balance sheets are in terrific shape, beneficiaries of everything from reduced spending and borrowing to governmental largesse during the pandemic. Take another look at the two charts above from the Federal Reserve laying out levels of household debt to personal income and real household income.
Two, there simply ain’t enough single-family homes to go around, with a lack of supply and persistent underbuilding following the 2007-2009 financial crisis, something I have written about repeatedly.
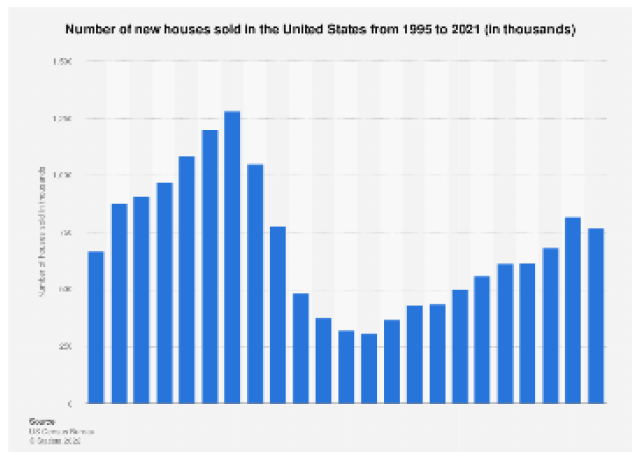
And finally, the influx of investors that have entered the single-family market, discussed at length in previous memos, present a newer source of housing demand. While investor activity may have slowed more recently as the likes of Zillow have left the market, investors are still active participants in the market. Data recently released from the National Rental Home Council and John Burns Real Estate Consulting shows that build-for-rent homes accounted for 26% of properties added to the portfolios of single-family rental home providers in the fourth quarter of last year, up from just 3% in Q3 2019. Of course, homes built specifically for rent reduces the already constrained supply of homes available for sale.
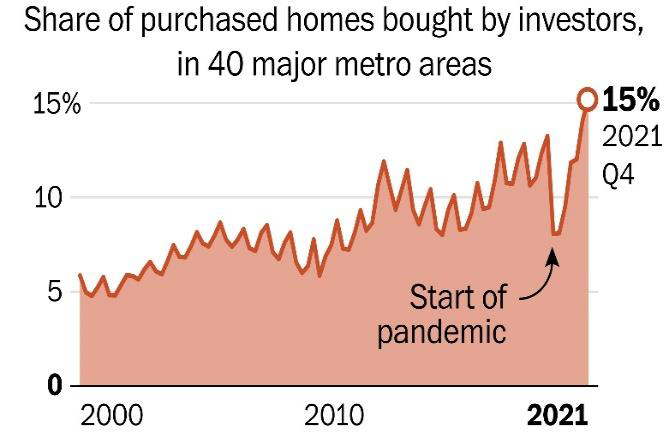
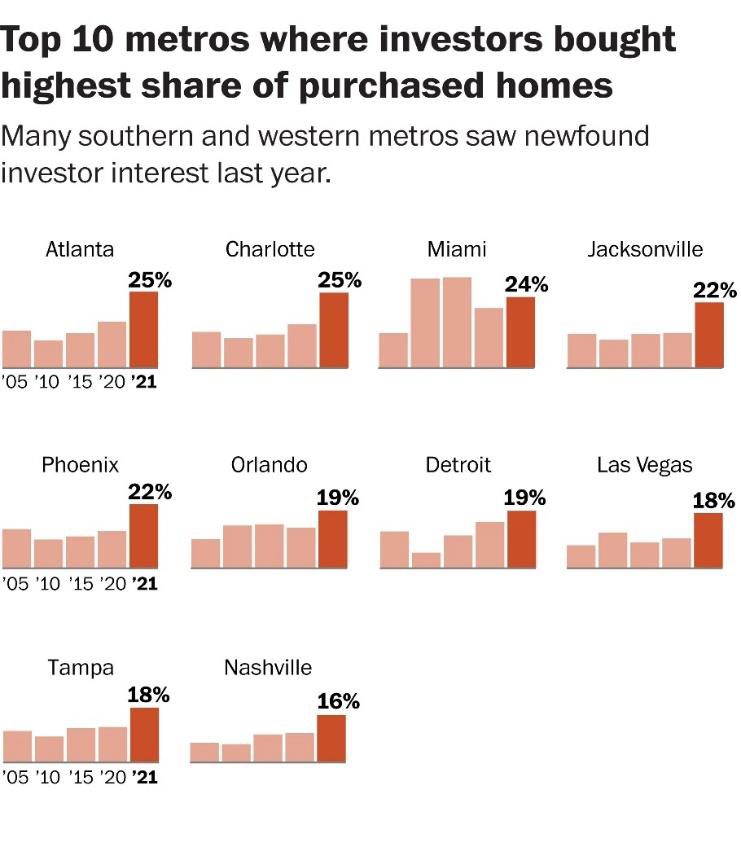
In fact, I recently read a Bloomberg article which introduced me to a single-family residential rental company I had never heard of previously, Pretium Partners, LLC, and its affiliate, Progress Residential, which raised $2.5 billion in 2019 and was the party that bought the homes that Zillow had to sell last year. Anyhow, it added 35,000 homes to its portfolio in 2021 alone and now owns about 75,000 homes. 75,000! And here I thought Clear Capital’s 5,000-unit multifamily portfolio was really something.
I realize some of you may read some of this and have a visceral response that all this institutional activity in our single-family housing markets is a big negative, increasing housing prices for families, changing the fabric of neighborhoods, and/or reducing opportunities to save for retirement through homeownership and related equity, and I can appreciate that perspective. On the other hand, many others will simply believe this is how capitalism and free markets work, and that allowing individuals and families to rent homes increases the pool of potential single-family occupants. I will stay out of the fray for now but would merely note that other wealthy countries like Denmark and Germany have lower rates of homeownership than the U.S., but far more robust social safety nets and pension benefits. In any event, the issue is as much economic as it is political, I suspect.
Finally, bank balance sheets are in far better shape than in the past, certainly less risky than in the period preceding the financial crisis when lenders were giving out mortgages like Butterfingers on Halloween. Some will point out, not incorrectly, that the “shadow banking system,” which includes financial institutions that are not regulated, has expanded significantly over time, making the overall system riskier than it may seem, but the overall systemic mortgage risks appear far more manageable than they were in 2007.
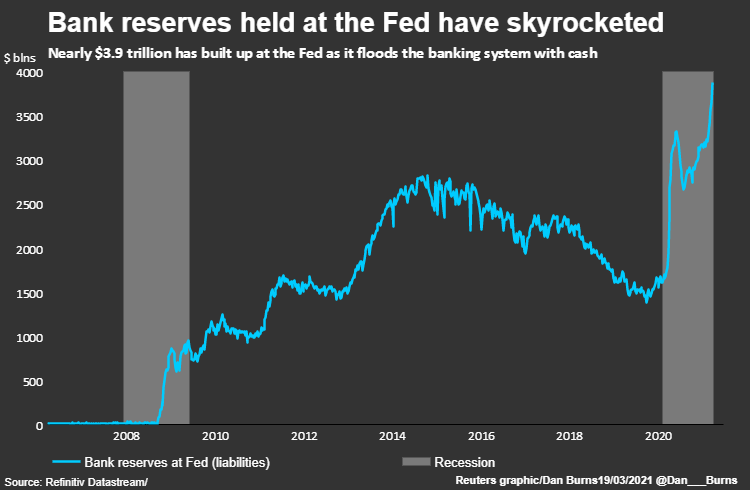
There may be one graph that looks a tad scary, one from Yale’s Robert Schiller (of Case-Schiller fame). The two lines I routinely think about are the correlation between real home prices and population. Common sense would tell us that the two should have reasonably high correlations, and over time, they do. However, the last time the disparity between the two was so significant was the period preceding the financial crisis.
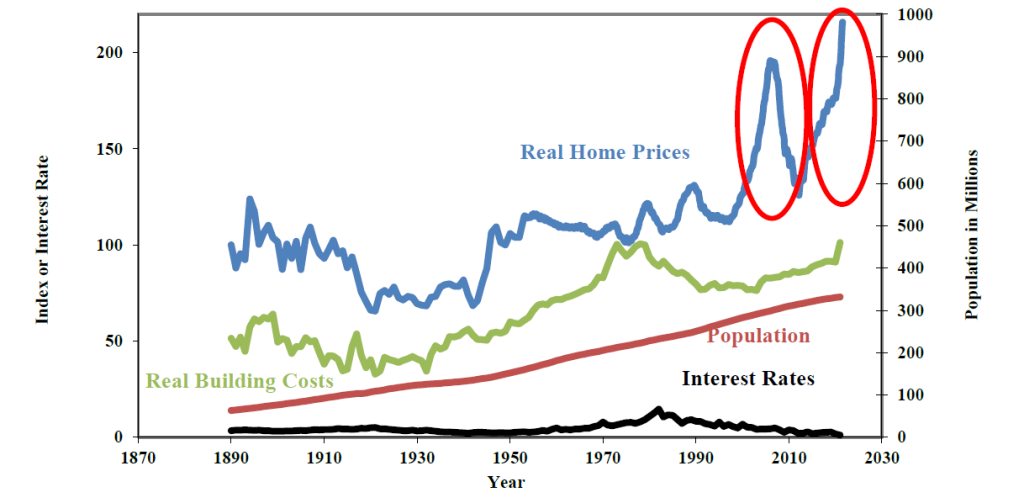
Again, what to make of it all? Is this time different? Overall, I believe the answer is “yes,” that those waiting for housing prices to drop will be disappointed, as I have said repeatedly in recent years. That is not to say that higher interest rates will not dampen demand at the margin because they will, and they must.
But with housing supply constrained, ample liquidity wherever one looks, the significant presence of institutional players in housing markets, and interest rates still relatively low by historical standards, I expect housing prices to remain high and rents to increase, extending trends over the past decade. Those increases will just moderate from recent trends.
With the major quarterly punchlines addressed, let’s take a more granular look at inflation and interest rates, since both dominate recent economic news and so profoundly impact financial assets and real estate markets
If you had just awoken from a six-month nap and glanced at a graph of U.S. Treasury rates, you would probably do a double-take. Maybe a triple-, as you took a large swig of whatever caffeinated drink you might have chosen after such a long slumber. In just the last six months, yields on 10-year Treasuries have more than doubled, from 1.40% to a recent 2.91%, an astonishing rise. As a result, the fixed income markets have been decimated, with bond prices suffering their worst drawdown on record. 30-year fixed mortgage rates have spiked to 5%, as detailed above, their highest levels in 12 years.
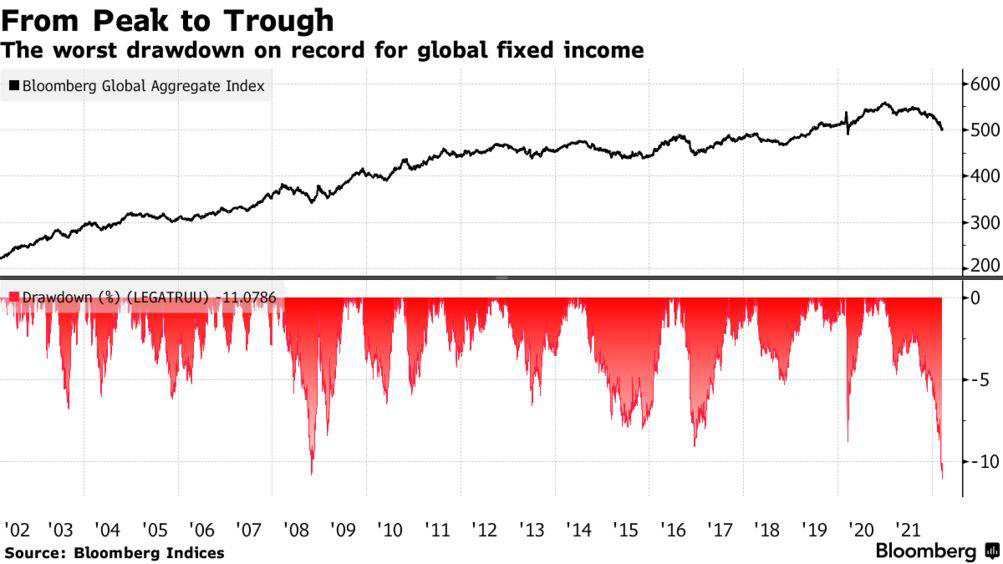
The culprits? Inflation, of course, as higher prices prove anything but transitory, and that over-the-top toner use by the Fed as it printed money like it was going out of style. Meanwhile, everything from Russian sanctions to the temporary shutdown of Shanghai to a slowdown in shipping across the Texas-Mexico border to a looming strike of more than 22,000 union dockworkers employed at 29 ports along the West Coast when their existing contract expires at the end of the June do not bode well for future inflation reports. The challenge is that higher prices are everywhere, from durable goods to travel to housing to food to energy prices. Heck, I won’t even tell you what I just paid for a standard coach ticket to Atlanta.
Just take a peek at what has happened to certain commodity prices, with wheat and corn prices up over 60% since the end of 2020. You can count on Wheat Thins getting thinner, Frosted Mini-Wheats getting “Minier,” and Corn Flakes becoming Corn Crumbs in coming months.
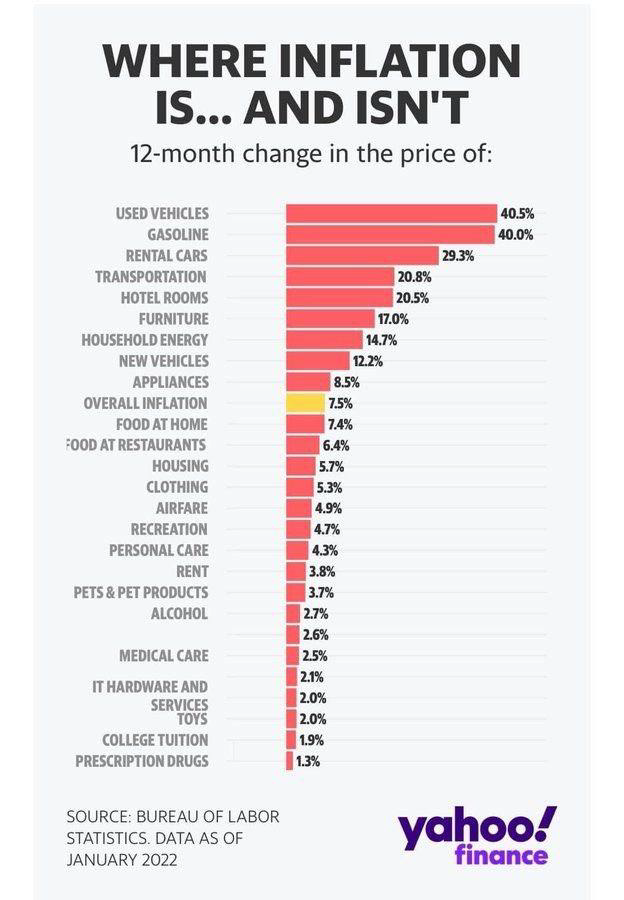
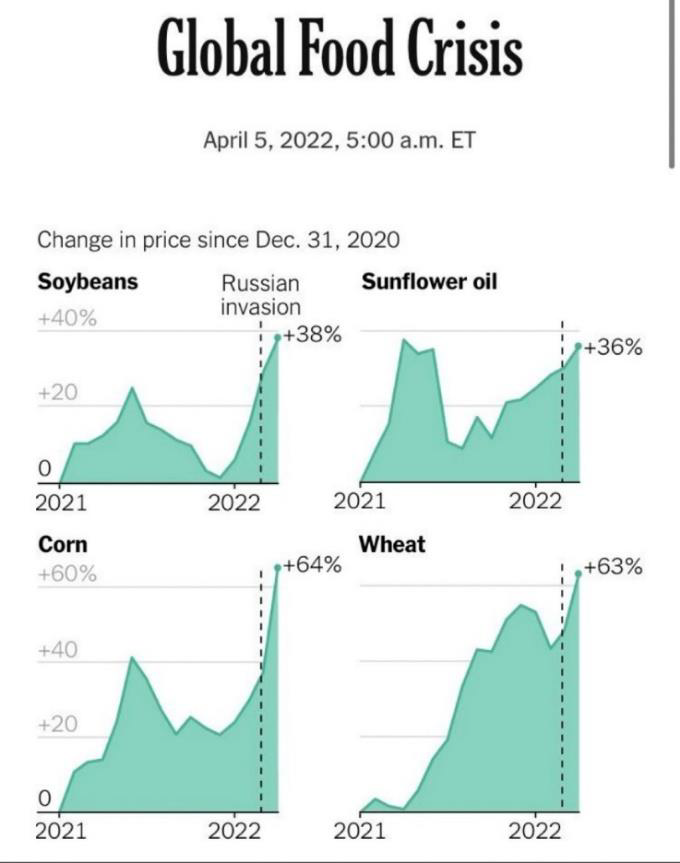
How will investors respond to persistent inflation, something so many investors have never experienced before? It is impossible to say with certainty, but equity and bond markets are likely to have a rough going this year and next, while real assets (yes, real estate) ought to fare much better. I would be very wary of investing in anything that resembles “fixed income” for the time being. In March alone, the Consumer and Producer Price Indices rose 1.2% and 1.0%, respectively, and 8.5% and 9.2%, year-over-year. Ouch.
And oil prices? It seems like only yesterday (end of 2020) when many Wall Street analysts, commentators, and fund managers (Exhibit A: Jim Cramer and Cathie Wood, if they count) were predicting that oil prices were down for the count and would never recover, after they had dropped over 30% that year. Oops. I remember a fellow UCLA faculty member in the Public Policy Department, who had studied the oil markets for his entire career, telling me that nobody can predict the price of oil, not even OPEC. He appears to be correct, as this graph clearly communicates.
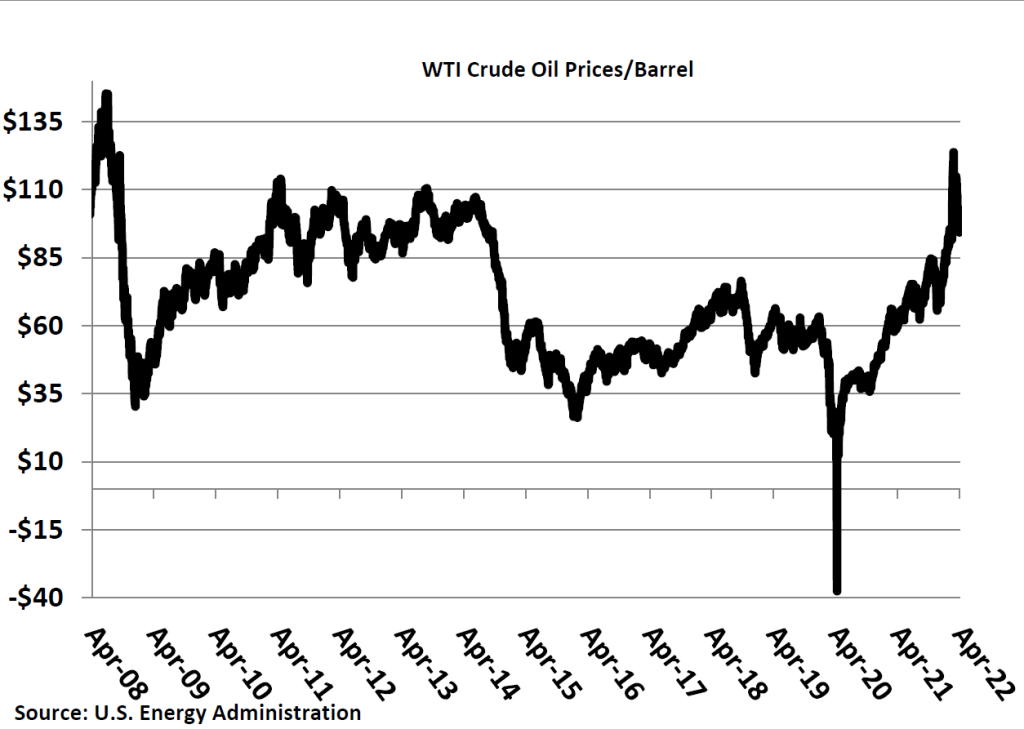
So, what is the Federal Reserve to do, while it fights a two-front war and the risks of persistent inflation and looming recession? Jerome Powell, the Fed Chair, may have the toughest job in America, right after Oscar host, coal miner, and ICU nurse (business school faculty member and real estate private equity managers are close runners-up). How much to raise rates? When? The Fed has indicated it expects to raise rates at least six more times this year, though many analysts are predicting seven to eight more increases, which would increase the Fed Funds rate from its current 0.50% to 2.0 to 2.25%. We shall see.
Meanwhile, the Fed has started its new Nutrisystem diet as it plans to shed $95 billion each month from its bloated $9 trillionish balance sheet, selling various securities it acquired in recent years as it implemented stimulus efforts and handed out money left, right, and center, which bloated its already hefty balance sheet by some 40% in just two years.
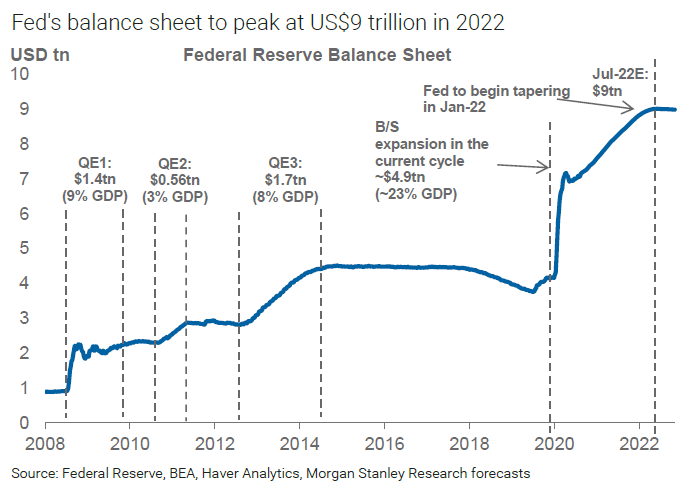
Higher interest rates continue to be in the cards, with the only question being how high do they go? These are such unprecedented times, it is simply hard to say, since so much depends on future inflation trends, and the to-be-determined Fed and investor response. What we are also seeing is not just higher rates, but higher spreads, the premium above Treasury rates that lenders are charging borrowers. In periods of uncertainty, lenders raise these spreads, which is hardly surprising.
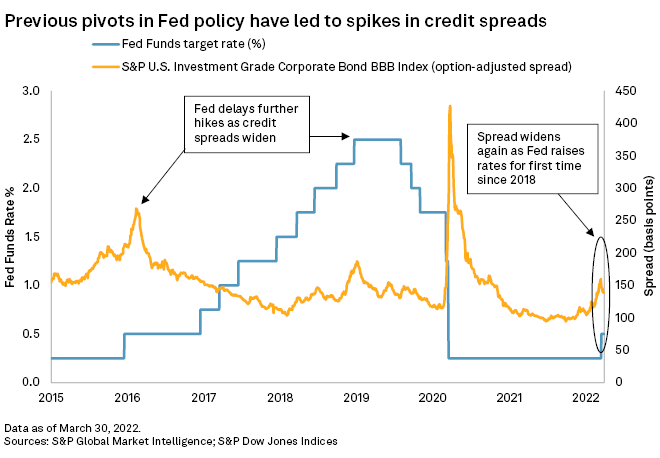
Obviously, Clear Capital has not been immune to these trends, and we have been significantly whipsawed by higher rates. Because our value-add strategy dictates that we obtain variable-rate, “bridge” financing until we complete our planned improvements and replace the bridge financing with permanent debt, we have suffered the double-whammy of both higher rates and widening spreads. While we routinely acquire interest rate caps to hedge against interest rate increases, caps provide only partial protection against rate rises.
From the most recent inflation data, there may be a reason to be marginally optimistic that inflation will subside. Though the overall CPI-U increased by 8.5% in March of 2022 from the prior year, core inflation, which excludes more volatile food and energy prices was up “only” 6.5%, or 0.3% for the month. I suppose it is a question of perspective, but 6.5% is still far higher inflation that we have experienced in decades. I imagine that most Fed meetings are fairly dull affairs, but I think this year’s meetings may just be a little interesting than most. A tad.
Fortunately, multifamily investments ought to provide a reasonably good hedge against higher inflation, as rents rise to offset higher operating and capital costs
Perhaps the most common question I am asked these days is how multifamily investments will fare in an environment of higher inflation. Of course, it essentially boils down to four variables: rents, operating costs, cap rates, and financing costs, and
whether rents will (more than) keep pace with higher operating expenses (and capital improvement costs), and whether cap rates expand along with higher financing costs.
Overall, while I think the multifamily sector will continue to be a relative bright spot, investors will need to temper their expectations on future returns, continuing a trend that has persisted over time. While rents will continue to rise, so will operating expenses, albeit more slowly, if just because certain operating expenses are fixed or relatively so and should not change linearly with rents. Meantime, higher borrowing costs are inescapable, of course. Our cost of debt has increased nearly 200 bps (two percent) in what seems like the blink of an eye.
According to Redfin, multifamily rents rose 15% in February, year-over-year, while mortgage payments spiked by spiked by 31 percent. Both figures are the highest since Redfin began tracking this in 2019. The hottest markets generally remain those in the southeast and southwest, from Miami to Tampa to Orlando to Austin to Vegas to Phoenix to Portland, all of which saw rental increases of more than 23% over the past year, 8.5% inflation be damned.
The biggest uncertainty is what happens to cap rates, which have steadily declined over the past decade. Common sense (which is often neither common or sensible) tells us that cap rates would have to move higher in the face of higher interest rates and resulting negative leverage, but there is still so much darn liquidity out there chasing investment opportunities and it is not exactly a secret that real assets should benefit from higher inflation. In the fourth quarter of last year, national cap rates reached a low of 4.7%, down 30 bps from the prior year.
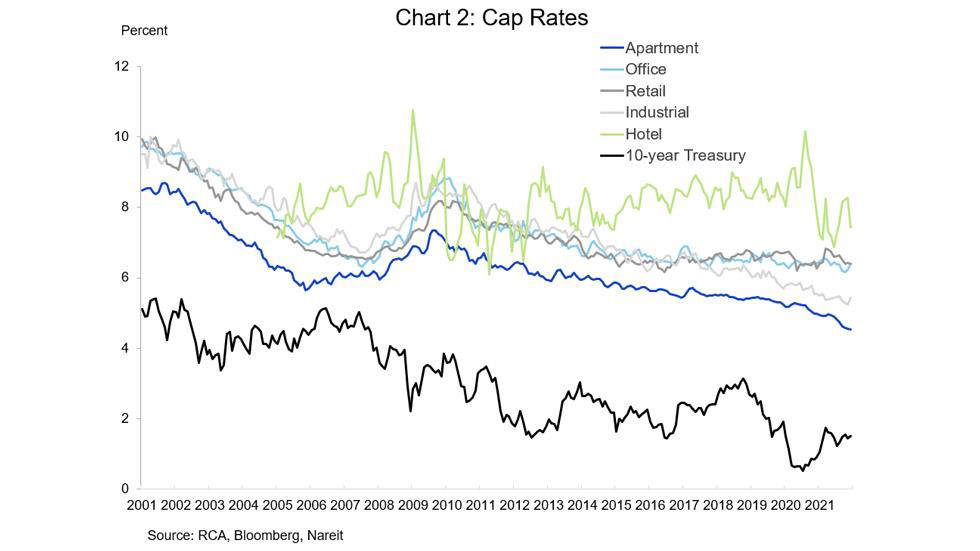
In a nutshell, I am optimistic that the multifamily, self-storage, and hospitality sectors should fare best in an inflationary environment, but future returns in all sectors will be lower than in recent years, and that investors of all sorts ought to temper expectations looking forward.
One economic bright spot remains the strong labor market, though attracting and retaining talent remain challenges
Despite the sobering headlines, the job market remains robust. Total nonfarm payroll employment rose by 431,000 in March and the unemployment rate declined to 3.6%, not too far away from the 50-year low of 3.5% we saw before the pandemic. Notable job gains were made in leisure and hospitality, professional and business services, retail trade, and manufacturing. Meantime, job openings remain at a record high, some 11.3 million at the end of February, while new jobless claims reached a 54-year low. In one sign of how desperate employers are to attract workers, Walmart is offering starting annual salaries of $110K for new truck drivers.
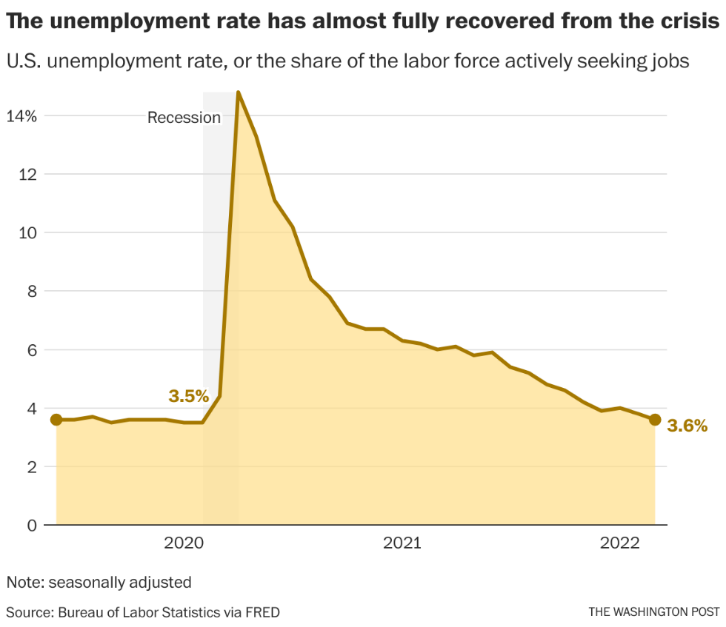
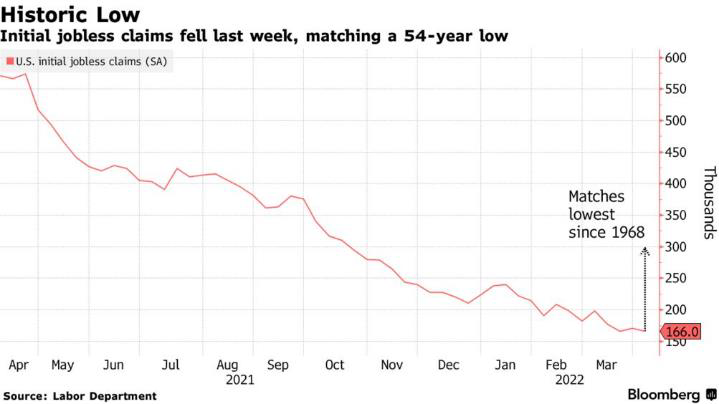
Finally, there were a couple of other interesting labor-related tidbits I happened to stumble upon that I thought were interesting. A recent article from the Economist argued that the pool of potential workers in the U.S. may be far smaller than previously thought because of the surge in asset values, which have increased household wealth, allowing many to work from home in some self-employed capacity or to leave the workforce (read: hang out poolside with mai-tai in hand) entirely. Data on “labor participation” seems consistent with this argument:
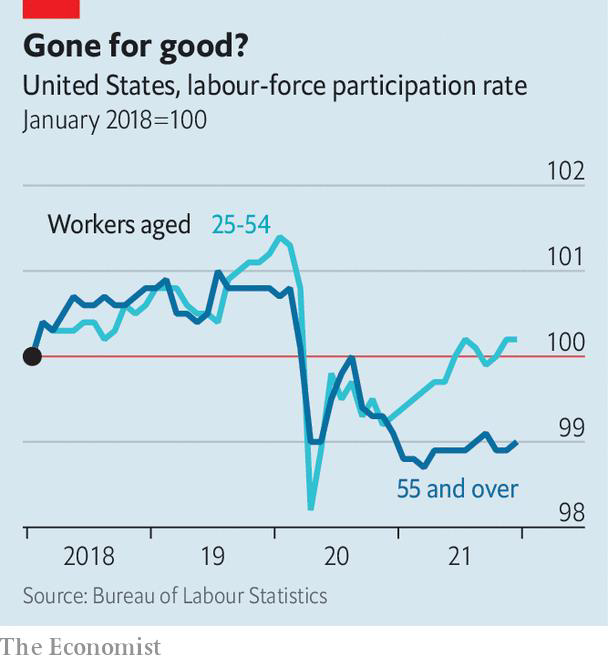
The other was the theory that many previous blue-collar workers – those working in construction, mining, and transportation – have transitioned to white collar positions, taking “office jobs,” as employers offer better pay, working conditions, and relax certain standards for employment, including the requirement that employees have a college degree. I suppose working for folks like Michael Scott, the fictional Regional Manager of Dunder Mifflin on “The Office” may look more appealing than driving for Walmart, no disrespect intended. The reality is that college enrollments dropped by one million during the pandemic, and as college gets more and more expensive, providing skills that might not translate to today’s workplaces, relaxing certain job prerequisites makes sense to me.
After a quiet end to 2021, politicians have been busy, busy bees in the first quarter, not just in California but throughout the country, as they deal with housing affordability and homelessness
Politicians continue to reach into their policy bags of tricks as they try, ineffectively, of course, to combat higher housing prices and rents. More broad use of rent controls and extensions of eviction moratoriums are mostly on the menu, while zoning restrictions are relaxed as well. The problem is that these policy changes either don’t work or are simply band-aids in nature, appealing to constituents, but offering little, if any, real relief. And, to be clear, these policy endeavors are not just limited to the “Blue States,” as these issues confront constituents just about everywhere.
• Senate Bill 9, “California Housing Opportunity and More Efficiency Act,” (whoever came up with this name should get an award), which I have mentioned previously, went into effect at the start of 2022, allows up to four units to be built on any particular lot previously zoned “R-1” and single-family units. The Wall Street Journal could not have been more effusive about the Bill, with one op-ed author estimating that around 2.5 million single-family homes could be converted to duplexes. However, the author is naïve, failing to recognize and appreciate the numerous impediments to additional construction, from the availability of contractors and subs, higher material costs, the permitting process, the higher cost of and access to debt or other capital that might be used to construct these additional units.
• Assembly Bill 2179: A week before California’s eviction moratorium was scheduled to expire, the Legislature announced and the governor signed into law a proposal to extend Covid-19 protections for tenants by an additional three months, to July, so that the state can “finish sending out rent relief payments.” California politicians have kicked this can down the road for so long, they are almost reaching the Oregon border.
• Regents of the University of California v. S.C. (Save Berkeley’s Neighborhoods): In 2019, a local neighborhood group, “Save Berkeley’s Neighborhoods,” sued the University to compel it to redo an environmental impact report regarding the impact on increased enrollment levels on everything from housing prices to traffic, and that the report that had previously been submitted violated California’s Environmental Quality Act. Between 2010 and 2020, attendance at UC Berkeley jumped up from around 36,000 students to over 42,000 students and now exceeds 45,000. In a ruling that surprised no one, at least not yours truly, the California Supreme Court ruled in favor of the Defendants and that the University must freeze enrollments for failing to provide enough housing for students around campus.
• Rent Control Bills in Numerous Jurisdictions: A recent Globe Street headline read, “Rent Control a Top Priority for Local Lawmakers,” the scariest publication title since “The Amityville Horror” (dating myself again). From Boston to Montclair (New Jersey), to mobile-home communities in Colorado, to several metros in Florida, proposed rent controls are on the menu. In those places with previously enacted rent controls, proposals to establish more restrictive caps on rent adjustments are in the works. In St Paul, Minnesota, for example, voters will decide whether to limit annual rent increases to 3%, regardless of inflation. Such a proposal, if passed, would constitute some of the more restrictive rent controls to be found in the country.
Frankly, there are others in the works, but in the interest of brevity (#sarcasm), I will leave discussion of other public policy brilliance to future quarterly updates, since I think you get the point.
And finally, before we put another quarterly chronicle to bed there are a few other economic, financial, or real estate related tidbits from the first quarter I found noteworthy
• Commercial real estate continues to shine: Despite facing many of the same headwinds as the multifamily markets, and others, from the increase in remote work and Amazon.com, commercial real estate values, from office buildings to shopping centers to industrial buildings to hotels, continue to appreciate. Obviously, excess liquidity remains a tailwind, as does the perception that real estate provides a reasonable inflationary hedge. According to Real Capital Analytics, commercial properties saw record sales last year, reaching $809 billion, nearly double 2020’s total and the previous record of $600 billion record in 2019, preceding the pandemic.
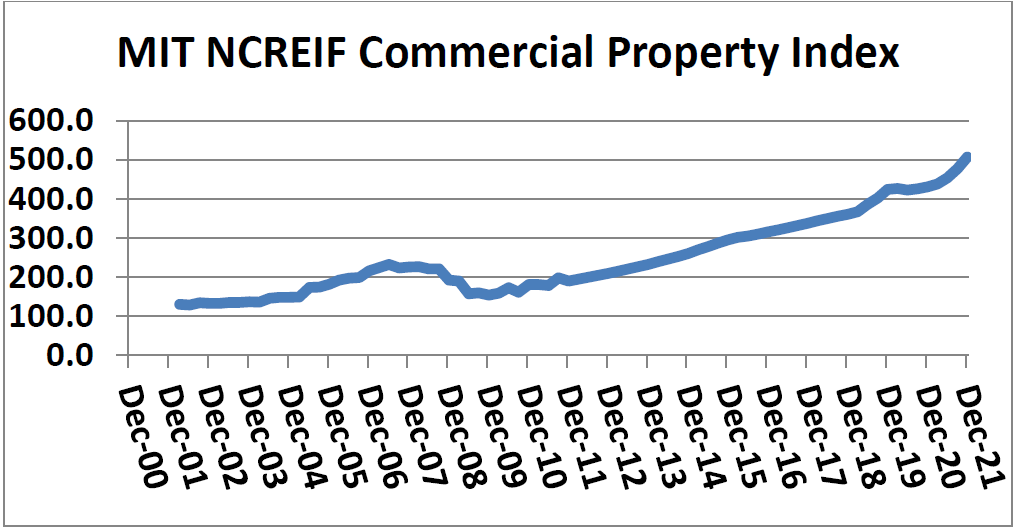
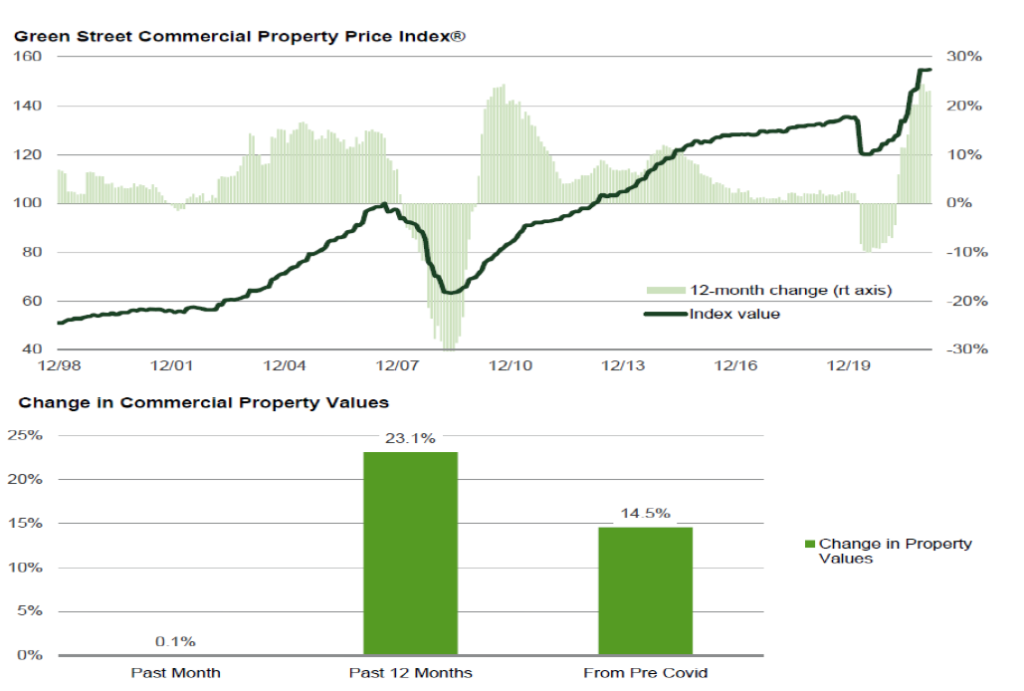
• Recent data confirms recent trends in demographic shifts and fertility rates: Data published by the U.S. Census Bureau at the end of March indicated that California saw a net loss of 262,000 residents for the year ended June 2021, with the lion’s share of the losses coming from Los Angeles County (159,621 people, about 1% of the total population). The second largest countywide loss was experienced in New York, which declined by about 111,000 residents (6.9%), followed by San Francisco (54,000 residents or 6.7%). Obviously, the Covid-19 pandemic was impactful, but the data underscores how California’s housing crisis and other demographic forces are reshaping some of the country’s largest cities.
Meantime, the following graph is a bit sobering as one thinks about long-term global economic growth. The bottom line is that global population growth is expected to continue to decline over time, with drops in economically developed nations being the most pronounced. Perhaps U.S. politicians should spend less time talking to media microphones and more time promulgating meaningful tax and immigration policy to stem this negative trend.
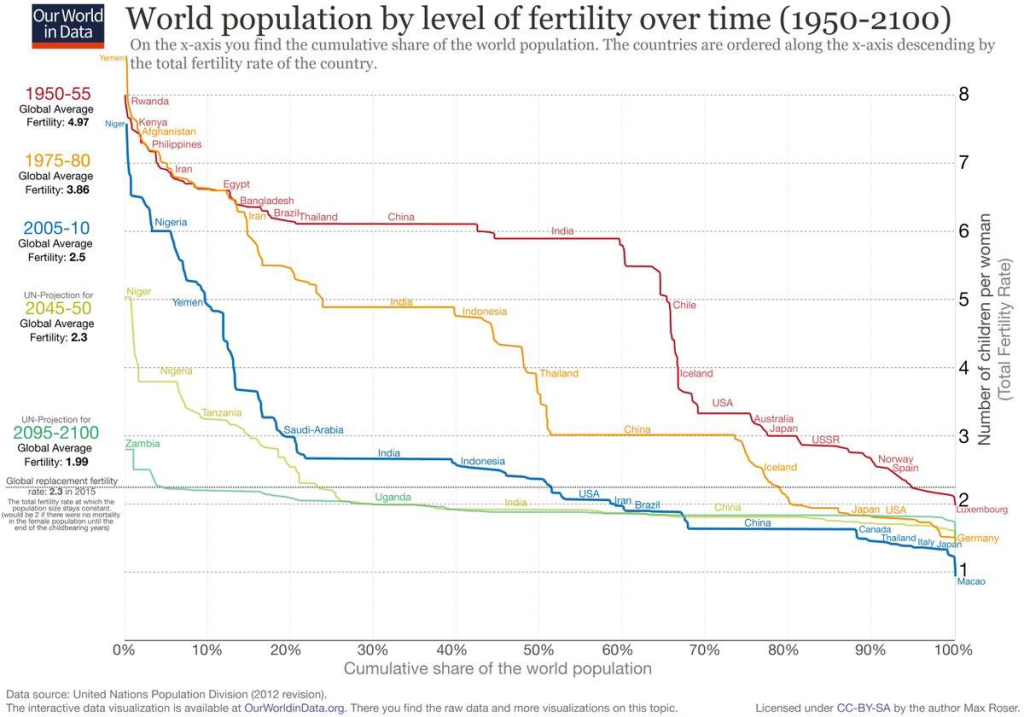
• Employers are beginning to mandate that employees return to work: In early March, Apple CEO, Tim Cook, told employees that they needed to return to the office full-time on April 11th. And if traffic on Los Angeles freeways is any indicator, most companies are asking employees to leave their home offices and Lululemon pants behind and return to the workplace. You may recall that I wrote sometime ago that I could not imagine firms hiring the best and brightest so that they could work separately and remotely from home, not with collaboration being so crucial. Perhaps employers recognize the importance of the ”Allen Curve,” named after the author of a 1970’s study, which indicated that communication between office workers declined exponentially with the distance between their desks.
Concluding Thoughts
As I look at the bottom of the MS Word version of this memo and realize that I am on page 24, I really hope that the second quarter will be less newsworthy. More than a few of you have noted that these memos continue to grow in length, and I can only tell you that it’s not my fault. There is just so much material economic data to digest and think about, and it is important that I/we do so.
Markets are fickle creatures and investor sentiments move on a dime (ok, a quarter or more given inflation), especially in this technological age. Just think about Phoenix for a moment. Fifteen years ago, during the Great Recession, Phoenix real estate prices tanked, and single-family foreclosures dotted every block. Prospective homebuyers in that market were able to shoot fish in a barrel, as they say. The median home price was something like $218,000. Fast forward to 2019, preceding the pandemic, and prices had increased, but modestly, to $285,000 (about 31%, or 2.5% annually). And today? The median price is $435,000 (a nearly 53% increase) and moving higher each week.
Perhaps the picture below from October 2020 says it all. Jim Cramer, one of my favorite television entertainers (comedians?), was waxing effusively about “The Magnificent Seven,” stocks in which “investors don’t care what they do. They just want to own the names.” Well, if you have some spare time on your hands, you might want to check out the charts for Netflix, Roku, Peloton, Square, Paypal, and Zoom, to see just how “magnificently” those stocks have done since then. Tesla is the only name yet to implode, so tread carefully.
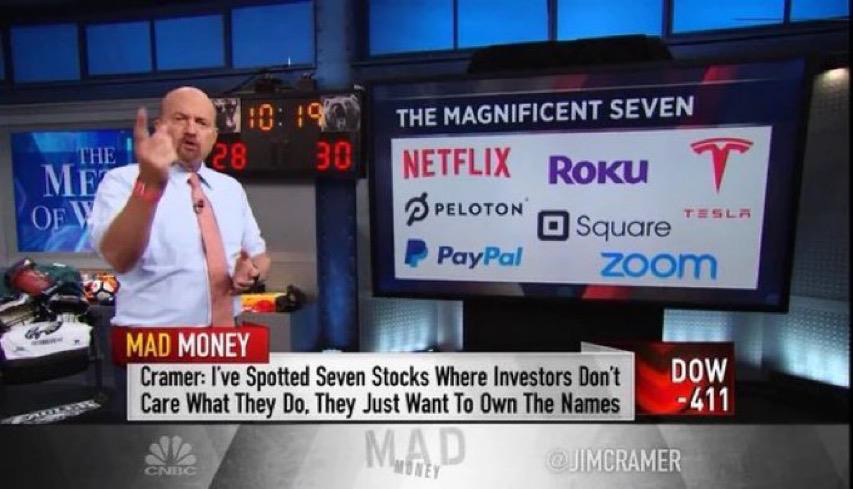
In closing, the beginning of 2022 has begun as I anticipated, with some significant headwinds and challenges (e.g., inflation, less accommodative Fed), and that was before Vladimir Putin decided to add his name to the sadly long list of despicable autocrats and warmongers. Investors will need to place capital thoughtfully during the first half of 2022, focusing on investments that can withstand if not perform well in excessively inflationary environments and paying close attention to data as it emerges.
Finally, and as always, we remain so appreciative of those of you who continue to support our firm and its endeavors. I am so grateful that that list is as lengthy as it is. And to those of you who somehow got through all 25+ pages of this missive, I owe you a very special round of thanks!
Best,

Eric Sussman